Biological Control Market Size

| Icons | Lable | Value |
|---|---|---|
|
|
Study Period | 2017 - 2029 |
|
|
Market Size (2023) | USD 6.58 Billion |
|
|
Market Size (2028) | USD 13.70 Billion |
|
|
Largest Share by Form | Macrobials |
|
|
CAGR (2023 - 2028) | 15.80 % |
|
|
Largest Share by Region | Asia-Pacific |
Major Players |
||
|
|
||
|
*Disclaimer: Major Players sorted in no particular order |
Biological Control Market Analysis
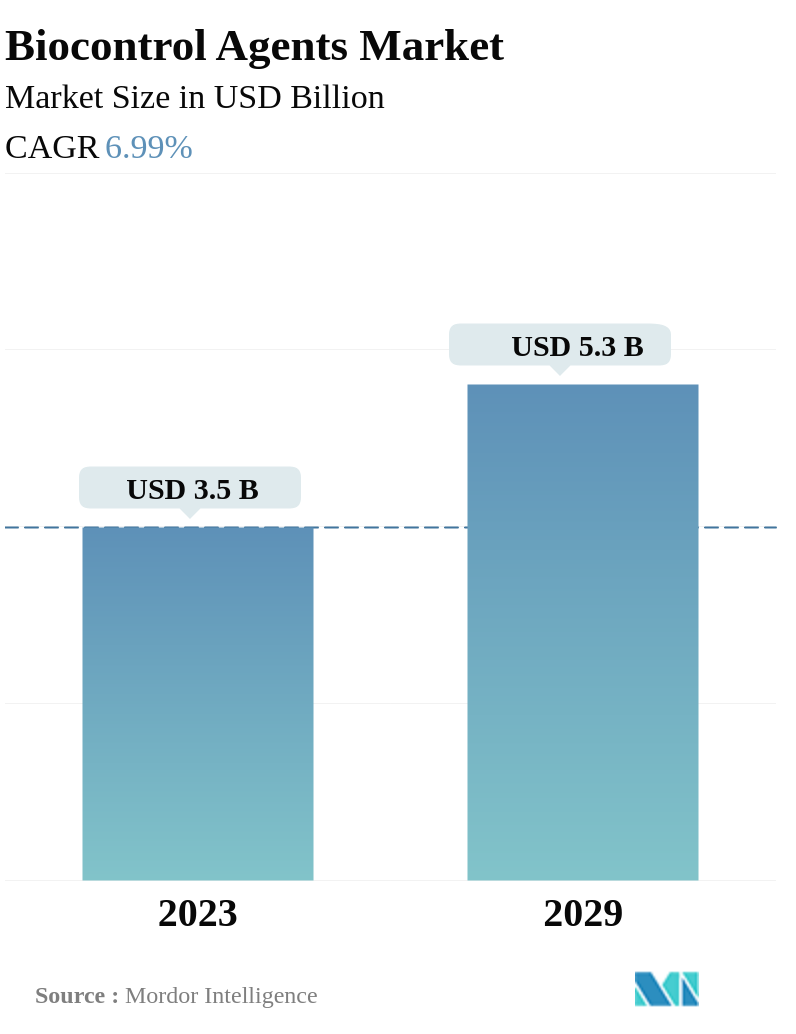
The Biological Control Market size is estimated at USD 6.58 billion in 2023, and is expected to reach USD 13.70 billion by 2028, growing at a CAGR of 15.80% during the forecast period (2023-2028).
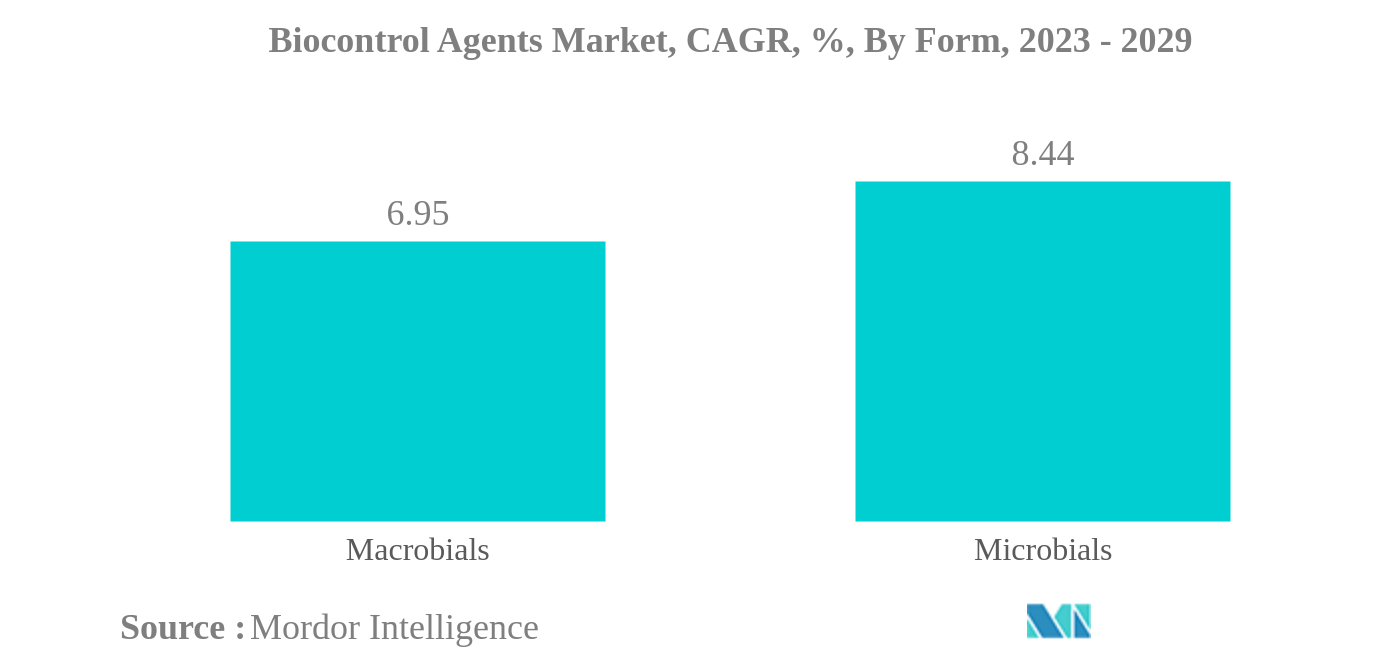
- Macrobials is the Largest Form. Predators are the most used macrobial biocontrol agents globally, with the largest market share which is due to their easy availability and faster reproductive capacity,
- Microbials is the Fastest-growing Form. Fungi biocontrol agents are dominantly used in a variety of crop types to keep pests under control. Trichoderma is the most commercially used, microbial biocontrol agents.
- Row Crops is the Largest Crop Type. The usage of biocontrol agents in row crops has a tremendous scope as the need for sustainable crop production is growing, and farmers are understanding their effectiveness.
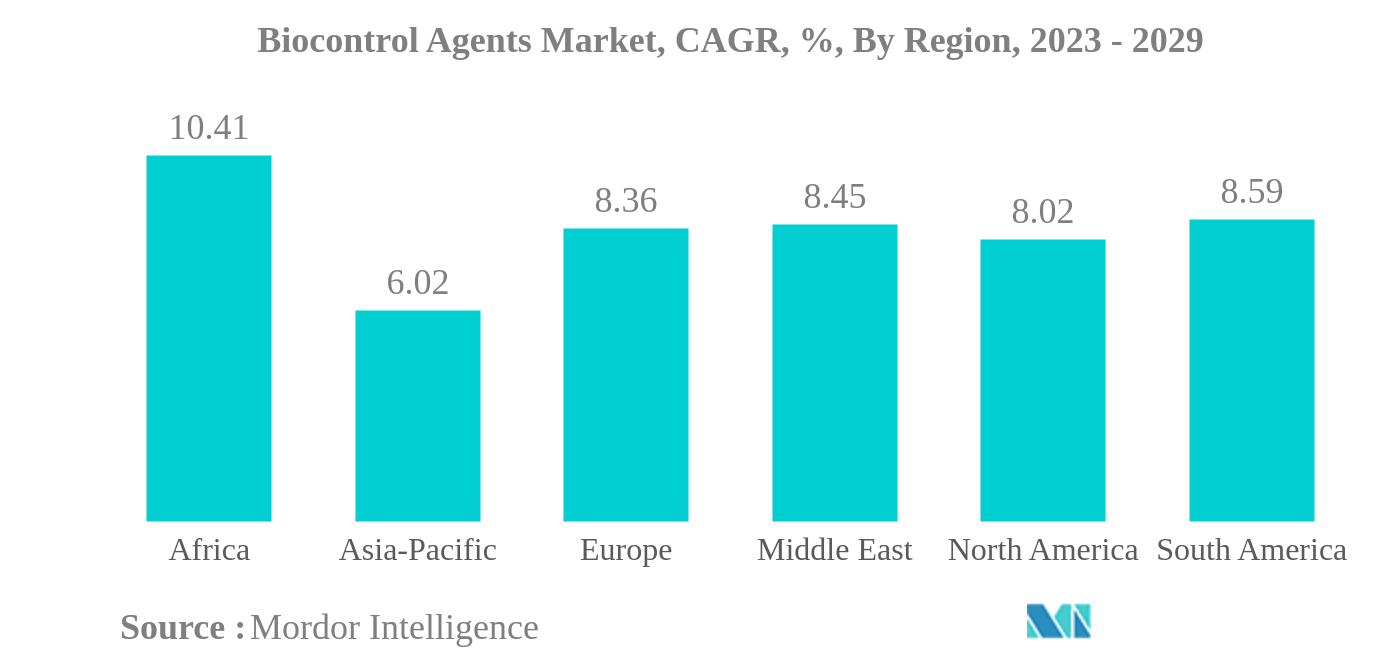
- Asia-Pacific is the Largest Region. India and China are the largest markets for the biocontrol agents. Various government and non-government initiatives to promote organic farming in the Asia-Pacific region.
Biological Control Market Trends
This section covers the major market trends shaping the Biocontrol Agents Market according to our research experts:
Macrobials is the largest Form
- The biocontrol agents industry is a rapidly growing industry that is poised to have a significant impact on global agricultural practices. In 2022, the market was valued at USD 3.2 million, with macrobial biocontrol agents dominating the industry due to their ability to control a wide range of pests. Predators accounted for 91% of the market value of macrobial biocontrol products, mostly attributed to their capacity to attack multiple pests across different life stages.
- Microbial biocontrol agents are gaining traction in the market. They were valued at USD 72.9 million in 2022. Microbial biocontrol agents are highly effective in controlling a wide range of diseases and pests, and they are easier to apply compared to macrobials.
- Fungal biocontrol agents, in particular, are highly sought after, accounting for 53.8% of the value of the global microbial biocontrol agents market in 2022. Trichoderma, in particular, is a commercially available biocontrol agent that is widely used in major crops to control root rotting, fusarium wilting, and seedling diseases.
- The use of biocontrol agents can reduce the need for chemical pesticides, which could directly reduce the overall cost of cultivation. The dominance of macrobial and microbial biocontrol agents and the widespread adoption of integrated pest management practices have led governments to promote integrated pest management tools to assist farmers and advisors. These factors are expected to drive the biocontrol agents market during the forecast period (2023-2029).
Asia-Pacific is the largest Region
- The Asia-Pacific region dominates the global biocontrol agents market, accounting for a significant 67.8% share in 2022. In this region, India is the largest market for biocontrol agents, with a share of 51.0% in 2022. The market for microbial biocontrol agents is particularly strong, accounting for 60.1% of the market in 2022. This is due to the fact that microbial agents are easy to multiply in commercial laboratories and are easier to apply than macrobial agents. However, predators are the most commonly used macrobial biocontrol agents, as they are readily available and have a faster reproductive capacity. This segment is projected to experience significant growth during the forecast period, with an estimated CAGR of 8.4% during the forecast period.
- In Europe, the market for biocontrol agents is significant, accounting for 14.3% of the global market share in 2022. Italy is the largest market in the region, with a share of 39.0% by value and 28.7% by volume. The market in Europe is expected to grow during the forecast period, with a projected CAGR of 7.6%. This growth is expected to be the result of the increasing cultivation of horticultural crops and the discovery of new pests that attack these crops.
- Europe has set a target to increase the total farmland under organic farming to at least 25% by 2030. The increasing demand for organic products and government and non-government initiatives to promote organic farming are expected to drive the market and market value during the forecast period. The biocontrol agents market is projected to experience significant growth in both Asia-Pacific and Europe, driven by factors such as the increasing demand for organic products and advancements in biocontrol technologies.
Biological Control Industry Overview
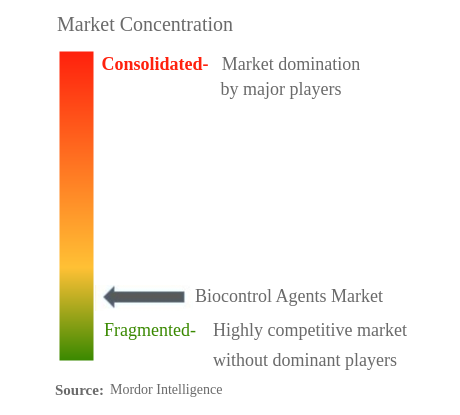
The Biocontrol Agents Market is fragmented, with the top five companies occupying 8.87%. The major players in this market are Biobee Ltd, Biobest Group NV, Bioline AgroSciences Ltd, Koppert Biological Systems Inc. and VIRIDAXIS SA (sorted alphabetically).
Biological Control Market Leaders
Biobee Ltd
Biobest Group NV
Bioline AgroSciences Ltd
Koppert Biological Systems Inc.
VIRIDAXIS SA
*Disclaimer: Major Players sorted in no particular order
Biological Control Market News
- October 2022: Koppert intends to invest in three new production units in Brazil, ensuring its leadership in the Brazilian and global markets for biological agricultural inputs. ′The new formulation unit will be located on an area of more than 8,000 m2 and will produce the entire microbiological line, including products based on viruses, fungi, and bacteria in liquid or solid formulations.
- September 2022: Andermatt Group AG opened its subsidiary in Mexico under the same segment with an aim to deliver Mexican farms with different biological solutions. This move helped the company strengthen its presence in Mexico.
- August 2022: Biobest announced the acquisition of Agronologica. The acquisition will allow enhanced access to Biobest’s technical expertise, product portfolio, and optimized logistics in Portugal.
Biological Control Market Report - Table of Contents
1. INTRODUCTION
1.1. Study Assumptions & Market Definition
1.2. Scope of the Study
1.3. Research Methodology
2. KEY INDUSTRY TRENDS
2.1. Area Under Organic Cultivation
2.2. Per Capita Spending On Organic Products
2.3. Regulatory Framework
2.4. Value Chain & Distribution Channel Analysis
3. MARKET SEGMENTATION
3.1. Form
3.1.1. Macrobials
3.1.1.1. By Organism
3.1.1.1.1. Entamopathogenic Nematodes
3.1.1.1.2. Parasitoids
3.1.1.1.3. Predators
3.1.2. Microbials
3.1.2.1. By Organism
3.1.2.1.1. Bacterial Biocontrol Agents
3.1.2.1.2. Fungal Biocontrol Agents
3.1.2.1.3. Other Microbials
3.2. Crop Type
3.2.1. Cash Crops
3.2.2. Horticultural Crops
3.2.3. Row Crops
3.3. Region
3.3.1. Africa
3.3.1.1. By Country
3.3.1.1.1. Egypt
3.3.1.1.2. Nigeria
3.3.1.1.3. South Africa
3.3.1.1.4. Rest of Africa
3.3.2. Asia-Pacific
3.3.2.1. By Country
3.3.2.1.1. Australia
3.3.2.1.2. China
3.3.2.1.3. India
3.3.2.1.4. Indonesia
3.3.2.1.5. Japan
3.3.2.1.6. Philippines
3.3.2.1.7. Thailand
3.3.2.1.8. Vietnam
3.3.2.1.9. Rest of Asia-Pacific
3.3.3. Europe
3.3.3.1. By Country
3.3.3.1.1. France
3.3.3.1.2. Germany
3.3.3.1.3. Italy
3.3.3.1.4. Netherlands
3.3.3.1.5. Russia
3.3.3.1.6. Spain
3.3.3.1.7. Turkey
3.3.3.1.8. United Kingdom
3.3.3.1.9. Rest of Europe
3.3.4. Middle East
3.3.4.1. By Country
3.3.4.1.1. Iran
3.3.4.1.2. Saudi Arabia
3.3.4.1.3. Rest of Middle East
3.3.5. North America
3.3.5.1. By Country
3.3.5.1.1. Canada
3.3.5.1.2. Mexico
3.3.5.1.3. United States
3.3.5.1.4. Rest of North America
3.3.6. South America
3.3.6.1. By Country
3.3.6.1.1. Argentina
3.3.6.1.2. Brazil
3.3.6.1.3. Rest of South America
4. COMPETITIVE LANDSCAPE
4.1. Key Strategic Moves
4.2. Market Share Analysis
4.3. Company Landscape
4.4. Company Profiles
4.4.1. Andermatt Group AG
4.4.2. Beneficial Insectary Inc.
4.4.3. Biobee Ltd
4.4.4. Biobest Group NV
4.4.5. Bioline AgroSciences Ltd
4.4.6. Bioworks Inc.
4.4.7. Henan Jiyuan Baiyun Industry Co. Ltd
4.4.8. Koppert Biological Systems Inc.
4.4.9. T Stanes and Company Limited
4.4.10. VIRIDAXIS SA
5. KEY STRATEGIC QUESTIONS FOR AGRICULTURAL BIOLOGICALS CEOS
6. APPENDIX
6.1. Global Overview
6.1.1. Overview
6.1.2. Porter’s Five Forces Framework
6.1.3. Global Value Chain Analysis
6.1.4. Market Dynamics (DROs)
6.2. Sources & References
6.3. List of Tables & Figures
6.4. Primary Insights
6.5. Data Pack
6.6. Glossary of Terms
List of Tables & Figures
- Figure 1:
- GLOBAL BIOCONTROL AGENTS MARKET, AREA UNDER ORGANIC CULTIVATION, HECTARES, 2017 - 2022
- Figure 2:
- GLOBAL BIOCONTROL AGENTS MARKET, PER CAPITA SPENDING ON ORGANIC PRODUCTS, USD, 2017 - 2022
- Figure 3:
- GLOBAL BIOCONTROL AGENTS MARKET, VOLUME, GRAM, 2017 - 2029
- Figure 4:
- GLOBAL BIOCONTROL AGENTS MARKET, VALUE, USD, 2017 - 2029
- Figure 5:
- GLOBAL BIOCONTROL AGENTS MARKET, BY FORM, VOLUME, GRAM, 2017 - 2029
- Figure 6:
- GLOBAL BIOCONTROL AGENTS MARKET, BY FORM, VALUE, USD, 2017 - 2029
- Figure 7:
- GLOBAL BIOCONTROL AGENTS MARKET, VOLUME SHARE(%), BY FORM, 2017 - 2029
- Figure 8:
- GLOBAL BIOCONTROL AGENTS MARKET, VALUE SHARE(%), BY FORM, 2017 - 2029
- Figure 9:
- GLOBAL BIOCONTROL AGENTS MARKET, BY ORGANISM, VOLUME, GRAM, 2017 - 2029
- Figure 10:
- GLOBAL BIOCONTROL AGENTS MARKET, BY ORGANISM, VALUE, USD, 2017 - 2029
- Figure 11:
- GLOBAL BIOCONTROL AGENTS MARKET, VOLUME SHARE(%), BY ORGANISM, 2017 - 2029
- Figure 12:
- GLOBAL BIOCONTROL AGENTS MARKET, VALUE SHARE(%), BY ORGANISM, 2017 - 2029
- Figure 13:
- GLOBAL BIOCONTROL AGENTS MARKET, BY ORGANISM, VOLUME, GRAM, 2017 - 2029
- Figure 14:
- GLOBAL BIOCONTROL AGENTS MARKET, BY ORGANISM, VALUE, USD, 2017 - 2029
- Figure 15:
- GLOBAL BIOCONTROL AGENTS MARKET, VALUE SHARE(%), BY CROP TYPE, 2022 - 2029
- Figure 16:
- GLOBAL BIOCONTROL AGENTS MARKET, BY ORGANISM, VOLUME, GRAM, 2017 - 2029
- Figure 17:
- GLOBAL BIOCONTROL AGENTS MARKET, BY ORGANISM, VALUE, USD, 2017 - 2029
- Figure 18:
- GLOBAL BIOCONTROL AGENTS MARKET, VALUE SHARE(%), BY CROP TYPE, 2022 - 2029
- Figure 19:
- GLOBAL BIOCONTROL AGENTS MARKET, BY ORGANISM, VOLUME, GRAM, 2017 - 2029
- Figure 20:
- GLOBAL BIOCONTROL AGENTS MARKET, BY ORGANISM, VALUE, USD, 2017 - 2029
- Figure 21:
- GLOBAL BIOCONTROL AGENTS MARKET, VALUE SHARE(%), BY CROP TYPE, 2022 - 2029
- Figure 22:
- GLOBAL BIOCONTROL AGENTS MARKET, BY ORGANISM, VOLUME, GRAM, 2017 - 2029
- Figure 23:
- GLOBAL BIOCONTROL AGENTS MARKET, BY ORGANISM, VALUE, USD, 2017 - 2029
- Figure 24:
- GLOBAL BIOCONTROL AGENTS MARKET, VOLUME SHARE(%), BY ORGANISM, 2017 - 2029
- Figure 25:
- GLOBAL BIOCONTROL AGENTS MARKET, VALUE SHARE(%), BY ORGANISM, 2017 - 2029
- Figure 26:
- GLOBAL BIOCONTROL AGENTS MARKET, BY ORGANISM, VOLUME, GRAM, 2017 - 2029
- Figure 27:
- GLOBAL BIOCONTROL AGENTS MARKET, BY ORGANISM, VALUE, USD, 2017 - 2029
- Figure 28:
- GLOBAL BIOCONTROL AGENTS MARKET, VALUE SHARE(%), BY CROP TYPE, 2022 - 2029
- Figure 29:
- GLOBAL BIOCONTROL AGENTS MARKET, BY ORGANISM, VOLUME, GRAM, 2017 - 2029
- Figure 30:
- GLOBAL BIOCONTROL AGENTS MARKET, BY ORGANISM, VALUE, USD, 2017 - 2029
- Figure 31:
- GLOBAL BIOCONTROL AGENTS MARKET, VALUE SHARE(%), BY CROP TYPE, 2022 - 2029
- Figure 32:
- GLOBAL BIOCONTROL AGENTS MARKET, BY ORGANISM, VOLUME, GRAM, 2017 - 2029
- Figure 33:
- GLOBAL BIOCONTROL AGENTS MARKET, BY ORGANISM, VALUE, USD, 2017 - 2029
- Figure 34:
- GLOBAL BIOCONTROL AGENTS MARKET, VALUE SHARE(%), BY CROP TYPE, 2022 - 2029
- Figure 35:
- GLOBAL BIOCONTROL AGENTS MARKET, BY CROP TYPE, VOLUME, GRAM, 2017 - 2029
- Figure 36:
- GLOBAL BIOCONTROL AGENTS MARKET, BY CROP TYPE, VALUE, USD, 2017 - 2029
- Figure 37:
- GLOBAL BIOCONTROL AGENTS MARKET, VOLUME SHARE(%), BY CROP TYPE, 2017 - 2029
- Figure 38:
- GLOBAL BIOCONTROL AGENTS MARKET, VALUE SHARE(%), BY CROP TYPE, 2017 - 2029
- Figure 39:
- GLOBAL BIOCONTROL AGENTS MARKET, BY CROP TYPE, VOLUME, GRAM, 2017 - 2029
- Figure 40:
- GLOBAL BIOCONTROL AGENTS MARKET, BY CROP TYPE, VALUE, USD, 2017 - 2029
- Figure 41:
- GLOBAL BIOCONTROL AGENTS MARKET, VALUE SHARE(%), BY FORM, 2022 - 2029
- Figure 42:
- GLOBAL BIOCONTROL AGENTS MARKET, BY CROP TYPE, VOLUME, GRAM, 2017 - 2029
- Figure 43:
- GLOBAL BIOCONTROL AGENTS MARKET, BY CROP TYPE, VALUE, USD, 2017 - 2029
- Figure 44:
- GLOBAL BIOCONTROL AGENTS MARKET, VALUE SHARE(%), BY FORM, 2022 - 2029
- Figure 45:
- GLOBAL BIOCONTROL AGENTS MARKET, BY CROP TYPE, VOLUME, GRAM, 2017 - 2029
- Figure 46:
- GLOBAL BIOCONTROL AGENTS MARKET, BY CROP TYPE, VALUE, USD, 2017 - 2029
- Figure 47:
- GLOBAL BIOCONTROL AGENTS MARKET, VALUE SHARE(%), BY FORM, 2022 - 2029
- Figure 48:
- GLOBAL BIOCONTROL AGENTS MARKET, BY REGION, VOLUME, GRAM, 2017 - 2029
- Figure 49:
- GLOBAL BIOCONTROL AGENTS MARKET, BY REGION, VALUE, USD, 2017 - 2029
- Figure 50:
- GLOBAL BIOCONTROL AGENTS MARKET, VOLUME SHARE(%), BY REGION, 2017 - 2029
- Figure 51:
- GLOBAL BIOCONTROL AGENTS MARKET, VALUE SHARE(%), BY REGION, 2017 - 2029
- Figure 52:
- GLOBAL BIOCONTROL AGENTS MARKET, BY COUNTRY, VOLUME, GRAM, 2017 - 2029
- Figure 53:
- GLOBAL BIOCONTROL AGENTS MARKET, BY COUNTRY, VALUE, USD, 2017 - 2029
- Figure 54:
- GLOBAL BIOCONTROL AGENTS MARKET, VOLUME SHARE(%), BY COUNTRY, 2017 - 2029
- Figure 55:
- GLOBAL BIOCONTROL AGENTS MARKET, VALUE SHARE(%), BY COUNTRY, 2017 - 2029
- Figure 56:
- GLOBAL BIOCONTROL AGENTS MARKET, BY COUNTRY, VOLUME, GRAM, 2017 - 2029
- Figure 57:
- GLOBAL BIOCONTROL AGENTS MARKET, BY COUNTRY, VALUE, USD, 2017 - 2029
- Figure 58:
- GLOBAL BIOCONTROL AGENTS MARKET, VALUE SHARE(%), BY FORM, 2022 - 2029
- Figure 59:
- GLOBAL BIOCONTROL AGENTS MARKET, BY COUNTRY, VOLUME, GRAM, 2017 - 2029
- Figure 60:
- GLOBAL BIOCONTROL AGENTS MARKET, BY COUNTRY, VALUE, USD, 2017 - 2029
- Figure 61:
- GLOBAL BIOCONTROL AGENTS MARKET, VALUE SHARE(%), BY FORM, 2022 - 2029
- Figure 62:
- GLOBAL BIOCONTROL AGENTS MARKET, BY COUNTRY, VOLUME, GRAM, 2017 - 2029
- Figure 63:
- GLOBAL BIOCONTROL AGENTS MARKET, BY COUNTRY, VALUE, USD, 2017 - 2029
- Figure 64:
- GLOBAL BIOCONTROL AGENTS MARKET, VALUE SHARE(%), BY FORM, 2022 - 2029
- Figure 65:
- GLOBAL BIOCONTROL AGENTS MARKET, BY COUNTRY, VOLUME, GRAM, 2017 - 2029
- Figure 66:
- GLOBAL BIOCONTROL AGENTS MARKET, BY COUNTRY, VALUE, USD, 2017 - 2029
- Figure 67:
- GLOBAL BIOCONTROL AGENTS MARKET, VALUE SHARE(%), BY FORM, 2022 - 2029
- Figure 68:
- GLOBAL BIOCONTROL AGENTS MARKET, BY COUNTRY, VOLUME, GRAM, 2017 - 2029
- Figure 69:
- GLOBAL BIOCONTROL AGENTS MARKET, BY COUNTRY, VALUE, USD, 2017 - 2029
- Figure 70:
- GLOBAL BIOCONTROL AGENTS MARKET, VOLUME SHARE(%), BY COUNTRY, 2017 - 2029
- Figure 71:
- GLOBAL BIOCONTROL AGENTS MARKET, VALUE SHARE(%), BY COUNTRY, 2017 - 2029
- Figure 72:
- GLOBAL BIOCONTROL AGENTS MARKET, BY COUNTRY, VOLUME, GRAM, 2017 - 2029
- Figure 73:
- GLOBAL BIOCONTROL AGENTS MARKET, BY COUNTRY, VALUE, USD, 2017 - 2029
- Figure 74:
- GLOBAL BIOCONTROL AGENTS MARKET, VALUE SHARE(%), BY FORM, 2022 - 2029
- Figure 75:
- GLOBAL BIOCONTROL AGENTS MARKET, BY COUNTRY, VOLUME, GRAM, 2017 - 2029
- Figure 76:
- GLOBAL BIOCONTROL AGENTS MARKET, BY COUNTRY, VALUE, USD, 2017 - 2029
- Figure 77:
- GLOBAL BIOCONTROL AGENTS MARKET, VALUE SHARE(%), BY FORM, 2022 - 2029
- Figure 78:
- GLOBAL BIOCONTROL AGENTS MARKET, BY COUNTRY, VOLUME, GRAM, 2017 - 2029
- Figure 79:
- GLOBAL BIOCONTROL AGENTS MARKET, BY COUNTRY, VALUE, USD, 2017 - 2029
- Figure 80:
- GLOBAL BIOCONTROL AGENTS MARKET, VALUE SHARE(%), BY FORM, 2022 - 2029
- Figure 81:
- GLOBAL BIOCONTROL AGENTS MARKET, BY COUNTRY, VOLUME, GRAM, 2017 - 2029
- Figure 82:
- GLOBAL BIOCONTROL AGENTS MARKET, BY COUNTRY, VALUE, USD, 2017 - 2029
- Figure 83:
- GLOBAL BIOCONTROL AGENTS MARKET, VALUE SHARE(%), BY FORM, 2022 - 2029
- Figure 84:
- GLOBAL BIOCONTROL AGENTS MARKET, BY COUNTRY, VOLUME, GRAM, 2017 - 2029
- Figure 85:
- GLOBAL BIOCONTROL AGENTS MARKET, BY COUNTRY, VALUE, USD, 2017 - 2029
- Figure 86:
- GLOBAL BIOCONTROL AGENTS MARKET, VALUE SHARE(%), BY FORM, 2022 - 2029
- Figure 87:
- GLOBAL BIOCONTROL AGENTS MARKET, BY COUNTRY, VOLUME, GRAM, 2017 - 2029
- Figure 88:
- GLOBAL BIOCONTROL AGENTS MARKET, BY COUNTRY, VALUE, USD, 2017 - 2029
- Figure 89:
- GLOBAL BIOCONTROL AGENTS MARKET, VALUE SHARE(%), BY FORM, 2022 - 2029
- Figure 90:
- GLOBAL BIOCONTROL AGENTS MARKET, BY COUNTRY, VOLUME, GRAM, 2017 - 2029
- Figure 91:
- GLOBAL BIOCONTROL AGENTS MARKET, BY COUNTRY, VALUE, USD, 2017 - 2029
- Figure 92:
- GLOBAL BIOCONTROL AGENTS MARKET, VALUE SHARE(%), BY FORM, 2022 - 2029
- Figure 93:
- GLOBAL BIOCONTROL AGENTS MARKET, BY COUNTRY, VOLUME, GRAM, 2017 - 2029
- Figure 94:
- GLOBAL BIOCONTROL AGENTS MARKET, BY COUNTRY, VALUE, USD, 2017 - 2029
- Figure 95:
- GLOBAL BIOCONTROL AGENTS MARKET, VALUE SHARE(%), BY FORM, 2022 - 2029
- Figure 96:
- GLOBAL BIOCONTROL AGENTS MARKET, BY COUNTRY, VOLUME, GRAM, 2017 - 2029
- Figure 97:
- GLOBAL BIOCONTROL AGENTS MARKET, BY COUNTRY, VALUE, USD, 2017 - 2029
- Figure 98:
- GLOBAL BIOCONTROL AGENTS MARKET, VALUE SHARE(%), BY FORM, 2022 - 2029
- Figure 99:
- GLOBAL BIOCONTROL AGENTS MARKET, BY COUNTRY, VOLUME, GRAM, 2017 - 2029
- Figure 100:
- GLOBAL BIOCONTROL AGENTS MARKET, BY COUNTRY, VALUE, USD, 2017 - 2029
- Figure 101:
- GLOBAL BIOCONTROL AGENTS MARKET, VOLUME SHARE(%), BY COUNTRY, 2017 - 2029
- Figure 102:
- GLOBAL BIOCONTROL AGENTS MARKET, VALUE SHARE(%), BY COUNTRY, 2017 - 2029
- Figure 103:
- GLOBAL BIOCONTROL AGENTS MARKET, BY COUNTRY, VOLUME, GRAM, 2017 - 2029
- Figure 104:
- GLOBAL BIOCONTROL AGENTS MARKET, BY COUNTRY, VALUE, USD, 2017 - 2029
- Figure 105:
- GLOBAL BIOCONTROL AGENTS MARKET, VALUE SHARE(%), BY FORM, 2022 - 2029
- Figure 106:
- GLOBAL BIOCONTROL AGENTS MARKET, BY COUNTRY, VOLUME, GRAM, 2017 - 2029
- Figure 107:
- GLOBAL BIOCONTROL AGENTS MARKET, BY COUNTRY, VALUE, USD, 2017 - 2029
- Figure 108:
- GLOBAL BIOCONTROL AGENTS MARKET, VALUE SHARE(%), BY FORM, 2022 - 2029
- Figure 109:
- GLOBAL BIOCONTROL AGENTS MARKET, BY COUNTRY, VOLUME, GRAM, 2017 - 2029
- Figure 110:
- GLOBAL BIOCONTROL AGENTS MARKET, BY COUNTRY, VALUE, USD, 2017 - 2029
- Figure 111:
- GLOBAL BIOCONTROL AGENTS MARKET, VALUE SHARE(%), BY FORM, 2022 - 2029
- Figure 112:
- GLOBAL BIOCONTROL AGENTS MARKET, BY COUNTRY, VOLUME, GRAM, 2017 - 2029
- Figure 113:
- GLOBAL BIOCONTROL AGENTS MARKET, BY COUNTRY, VALUE, USD, 2017 - 2029
- Figure 114:
- GLOBAL BIOCONTROL AGENTS MARKET, VALUE SHARE(%), BY FORM, 2022 - 2029
- Figure 115:
- GLOBAL BIOCONTROL AGENTS MARKET, BY COUNTRY, VOLUME, GRAM, 2017 - 2029
- Figure 116:
- GLOBAL BIOCONTROL AGENTS MARKET, BY COUNTRY, VALUE, USD, 2017 - 2029
- Figure 117:
- GLOBAL BIOCONTROL AGENTS MARKET, VALUE SHARE(%), BY FORM, 2022 - 2029
- Figure 118:
- GLOBAL BIOCONTROL AGENTS MARKET, BY COUNTRY, VOLUME, GRAM, 2017 - 2029
- Figure 119:
- GLOBAL BIOCONTROL AGENTS MARKET, BY COUNTRY, VALUE, USD, 2017 - 2029
- Figure 120:
- GLOBAL BIOCONTROL AGENTS MARKET, VALUE SHARE(%), BY FORM, 2022 - 2029
- Figure 121:
- GLOBAL BIOCONTROL AGENTS MARKET, BY COUNTRY, VOLUME, GRAM, 2017 - 2029
- Figure 122:
- GLOBAL BIOCONTROL AGENTS MARKET, BY COUNTRY, VALUE, USD, 2017 - 2029
- Figure 123:
- GLOBAL BIOCONTROL AGENTS MARKET, VALUE SHARE(%), BY FORM, 2022 - 2029
- Figure 124:
- GLOBAL BIOCONTROL AGENTS MARKET, BY COUNTRY, VOLUME, GRAM, 2017 - 2029
- Figure 125:
- GLOBAL BIOCONTROL AGENTS MARKET, BY COUNTRY, VALUE, USD, 2017 - 2029
- Figure 126:
- GLOBAL BIOCONTROL AGENTS MARKET, VALUE SHARE(%), BY FORM, 2022 - 2029
- Figure 127:
- GLOBAL BIOCONTROL AGENTS MARKET, BY COUNTRY, VOLUME, GRAM, 2017 - 2029
- Figure 128:
- GLOBAL BIOCONTROL AGENTS MARKET, BY COUNTRY, VALUE, USD, 2017 - 2029
- Figure 129:
- GLOBAL BIOCONTROL AGENTS MARKET, VALUE SHARE(%), BY FORM, 2022 - 2029
- Figure 130:
- GLOBAL BIOCONTROL AGENTS MARKET, BY COUNTRY, VOLUME, GRAM, 2017 - 2029
- Figure 131:
- GLOBAL BIOCONTROL AGENTS MARKET, BY COUNTRY, VALUE, USD, 2017 - 2029
- Figure 132:
- GLOBAL BIOCONTROL AGENTS MARKET, VOLUME SHARE(%), BY COUNTRY, 2017 - 2029
- Figure 133:
- GLOBAL BIOCONTROL AGENTS MARKET, VALUE SHARE(%), BY COUNTRY, 2017 - 2029
- Figure 134:
- GLOBAL BIOCONTROL AGENTS MARKET, BY COUNTRY, VOLUME, GRAM, 2017 - 2029
- Figure 135:
- GLOBAL BIOCONTROL AGENTS MARKET, BY COUNTRY, VALUE, USD, 2017 - 2029
- Figure 136:
- GLOBAL BIOCONTROL AGENTS MARKET, VALUE SHARE(%), BY FORM, 2022 - 2029
- Figure 137:
- GLOBAL BIOCONTROL AGENTS MARKET, BY COUNTRY, VOLUME, GRAM, 2017 - 2029
- Figure 138:
- GLOBAL BIOCONTROL AGENTS MARKET, BY COUNTRY, VALUE, USD, 2017 - 2029
- Figure 139:
- GLOBAL BIOCONTROL AGENTS MARKET, VALUE SHARE(%), BY FORM, 2022 - 2029
- Figure 140:
- GLOBAL BIOCONTROL AGENTS MARKET, BY COUNTRY, VOLUME, GRAM, 2017 - 2029
- Figure 141:
- GLOBAL BIOCONTROL AGENTS MARKET, BY COUNTRY, VALUE, USD, 2017 - 2029
- Figure 142:
- GLOBAL BIOCONTROL AGENTS MARKET, VALUE SHARE(%), BY FORM, 2022 - 2029
- Figure 143:
- GLOBAL BIOCONTROL AGENTS MARKET, BY COUNTRY, VOLUME, GRAM, 2017 - 2029
- Figure 144:
- GLOBAL BIOCONTROL AGENTS MARKET, BY COUNTRY, VALUE, USD, 2017 - 2029
- Figure 145:
- GLOBAL BIOCONTROL AGENTS MARKET, VOLUME SHARE(%), BY COUNTRY, 2017 - 2029
- Figure 146:
- GLOBAL BIOCONTROL AGENTS MARKET, VALUE SHARE(%), BY COUNTRY, 2017 - 2029
- Figure 147:
- GLOBAL BIOCONTROL AGENTS MARKET, BY COUNTRY, VOLUME, GRAM, 2017 - 2029
- Figure 148:
- GLOBAL BIOCONTROL AGENTS MARKET, BY COUNTRY, VALUE, USD, 2017 - 2029
- Figure 149:
- GLOBAL BIOCONTROL AGENTS MARKET, VALUE SHARE(%), BY FORM, 2022 - 2029
- Figure 150:
- GLOBAL BIOCONTROL AGENTS MARKET, BY COUNTRY, VOLUME, GRAM, 2017 - 2029
- Figure 151:
- GLOBAL BIOCONTROL AGENTS MARKET, BY COUNTRY, VALUE, USD, 2017 - 2029
- Figure 152:
- GLOBAL BIOCONTROL AGENTS MARKET, VALUE SHARE(%), BY FORM, 2022 - 2029
- Figure 153:
- GLOBAL BIOCONTROL AGENTS MARKET, BY COUNTRY, VOLUME, GRAM, 2017 - 2029
- Figure 154:
- GLOBAL BIOCONTROL AGENTS MARKET, BY COUNTRY, VALUE, USD, 2017 - 2029
- Figure 155:
- GLOBAL BIOCONTROL AGENTS MARKET, VALUE SHARE(%), BY FORM, 2022 - 2029
- Figure 156:
- GLOBAL BIOCONTROL AGENTS MARKET, BY COUNTRY, VOLUME, GRAM, 2017 - 2029
- Figure 157:
- GLOBAL BIOCONTROL AGENTS MARKET, BY COUNTRY, VALUE, USD, 2017 - 2029
- Figure 158:
- GLOBAL BIOCONTROL AGENTS MARKET, VALUE SHARE(%), BY FORM, 2022 - 2029
- Figure 159:
- GLOBAL BIOCONTROL AGENTS MARKET, BY COUNTRY, VOLUME, GRAM, 2017 - 2029
- Figure 160:
- GLOBAL BIOCONTROL AGENTS MARKET, BY COUNTRY, VALUE, USD, 2017 - 2029
- Figure 161:
- GLOBAL BIOCONTROL AGENTS MARKET, VOLUME SHARE(%), BY COUNTRY, 2017 - 2029
- Figure 162:
- GLOBAL BIOCONTROL AGENTS MARKET, VALUE SHARE(%), BY COUNTRY, 2017 - 2029
- Figure 163:
- GLOBAL BIOCONTROL AGENTS MARKET, BY COUNTRY, VOLUME, GRAM, 2017 - 2029
- Figure 164:
- GLOBAL BIOCONTROL AGENTS MARKET, BY COUNTRY, VALUE, USD, 2017 - 2029
- Figure 165:
- GLOBAL BIOCONTROL AGENTS MARKET, VALUE SHARE(%), BY FORM, 2022 - 2029
- Figure 166:
- GLOBAL BIOCONTROL AGENTS MARKET, BY COUNTRY, VOLUME, GRAM, 2017 - 2029
- Figure 167:
- GLOBAL BIOCONTROL AGENTS MARKET, BY COUNTRY, VALUE, USD, 2017 - 2029
- Figure 168:
- GLOBAL BIOCONTROL AGENTS MARKET, VALUE SHARE(%), BY FORM, 2022 - 2029
- Figure 169:
- GLOBAL BIOCONTROL AGENTS MARKET, BY COUNTRY, VOLUME, GRAM, 2017 - 2029
- Figure 170:
- GLOBAL BIOCONTROL AGENTS MARKET, BY COUNTRY, VALUE, USD, 2017 - 2029
- Figure 171:
- GLOBAL BIOCONTROL AGENTS MARKET, VALUE SHARE(%), BY FORM, 2022 - 2029
- Figure 172:
- GLOBAL BIOCONTROL AGENTS MARKET, MOST ACTIVE COMPANIES, BY NUMBER OF STRATEGIC MOVES, 2017-2022
- Figure 173:
- GLOBAL BIOCONTROL AGENTS MARKET, MOST ADOPTED STRATEGIES, 2017-2022
- Figure 174:
- GLOBAL BIOCONTROL AGENTS MARKET SHARE(%), BY MAJOR PLAYERS, 2022
Biological Control Industry Segmentation
Macrobials, Microbials are covered as segments by Form. Cash Crops, Horticultural Crops, Row Crops are covered as segments by Crop Type. Africa, Asia-Pacific, Europe, Middle East, North America, South America are covered as segments by Region.| Form | |||||||
| |||||||
|
| Crop Type | |
| Cash Crops | |
| Horticultural Crops | |
| Row Crops |
| Region | |||||||||||||
| |||||||||||||
| |||||||||||||
| |||||||||||||
| |||||||||||||
| |||||||||||||
|
Market Definition
- AVERAGE DOSAGE RATE - This refers to the average volume of biocontrol agents applied per hectare of farmland in the respective region/country.
- CROP TYPE - Row Crops: Cereals, Pulses, Oilseeds, and Forage Crops Horticulture: Fruits, and Vegetables, Cash Crops: Plantation Crops and Spices.
- FUNCTIONS - Biocontrol Agents
- MARKET ESTIMATION LEVEL - Market Estimations for various types of biocontrol agents has been done at the product-level.
Research Methodology
Mordor Intelligence follows a four-step methodology in all our reports.
- Step-1: Identify Key Variables: In order to build a robust forecasting methodology, the variables and factors identified in Step-1 are tested against available historical market numbers. Through an iterative process, the variables required for market forecast are set and the model is built on the basis of these variables.
- Step-2: Build a Market Model: Market-size estimations for the forecast years are in nominal terms. Inflation is not a part of the pricing, and the average selling price (ASP) is kept constant throughout the forecast period.
- Step-3: Validate and Finalize: In this important step, all market numbers, variables and analyst calls are validated through an extensive network of primary research experts from the market studied. The respondents are selected across levels and functions to generate a holistic picture of the market studied.
- Step-4: Research Outputs: Syndicated Reports, Custom Consulting Assignments, Databases & Subscription Platforms.


