Europe Seafood Market Size

| Icons | Lable | Value |
|---|---|---|
|
|
Study Period | 2016 - 2028 |
|
|
Base Year For Estimation | 2021 |
|
|
CAGR | 0.38 % |
|
|
Largest Share by Type | Fish |
|
|
Largest Share by Country | France |
|
|
Market Concentration | High |
Major Players |
||
|
|
||
|
*Disclaimer: Major Players sorted in no particular order |
Europe Seafood Market Analysis
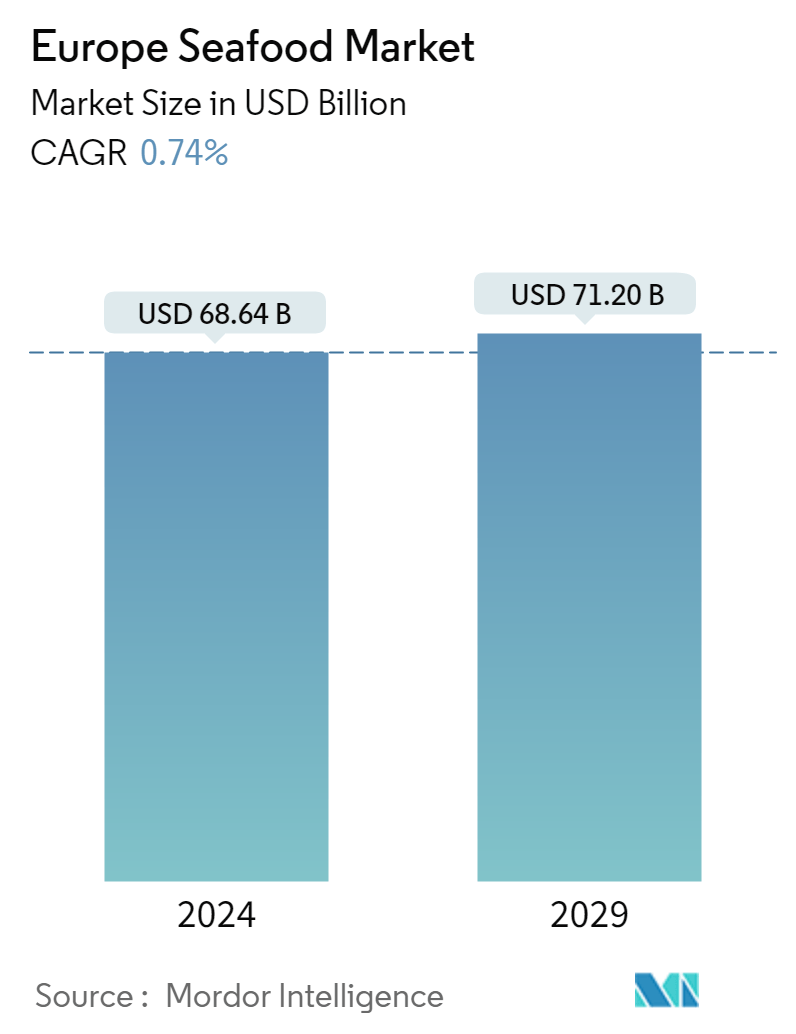
The Europe Seafood Market is projected to register a CAGR of 0.38%
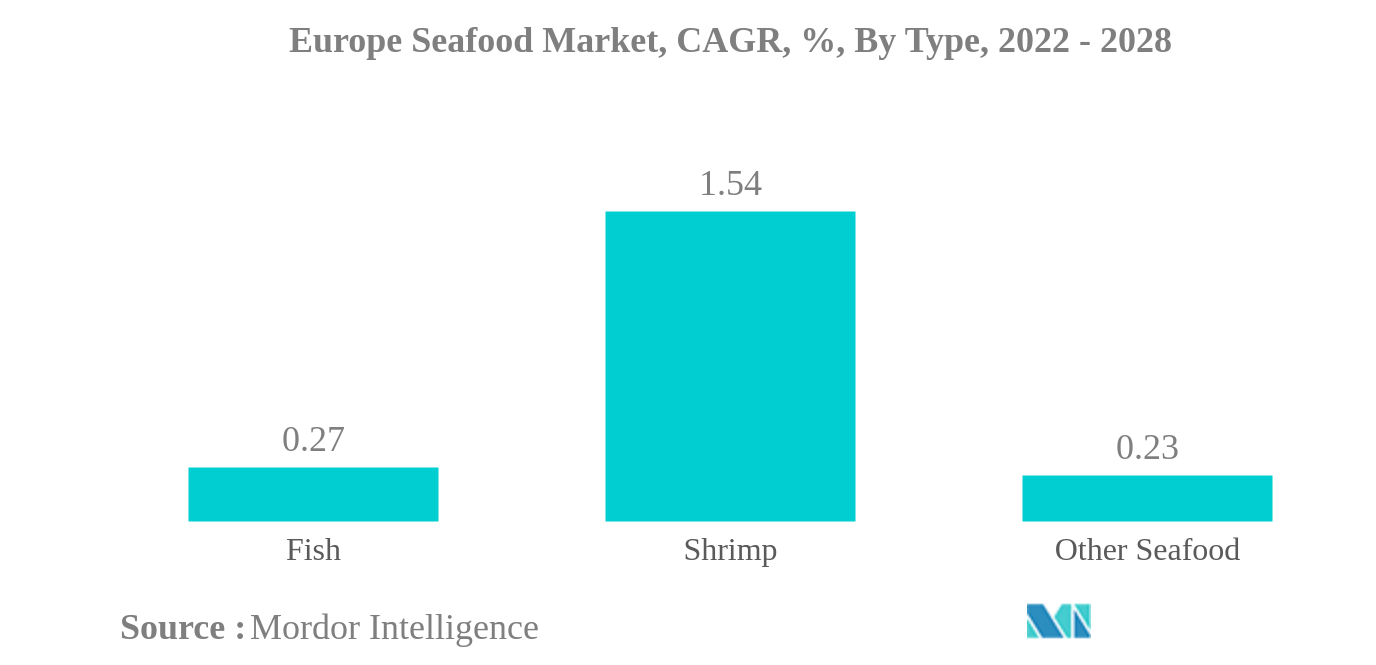
- Fish is the Largest Type : The household expenditure on European fish products grew by 17% in 2020. The demand for preserved and processed fish products is also projected to increase in the future.
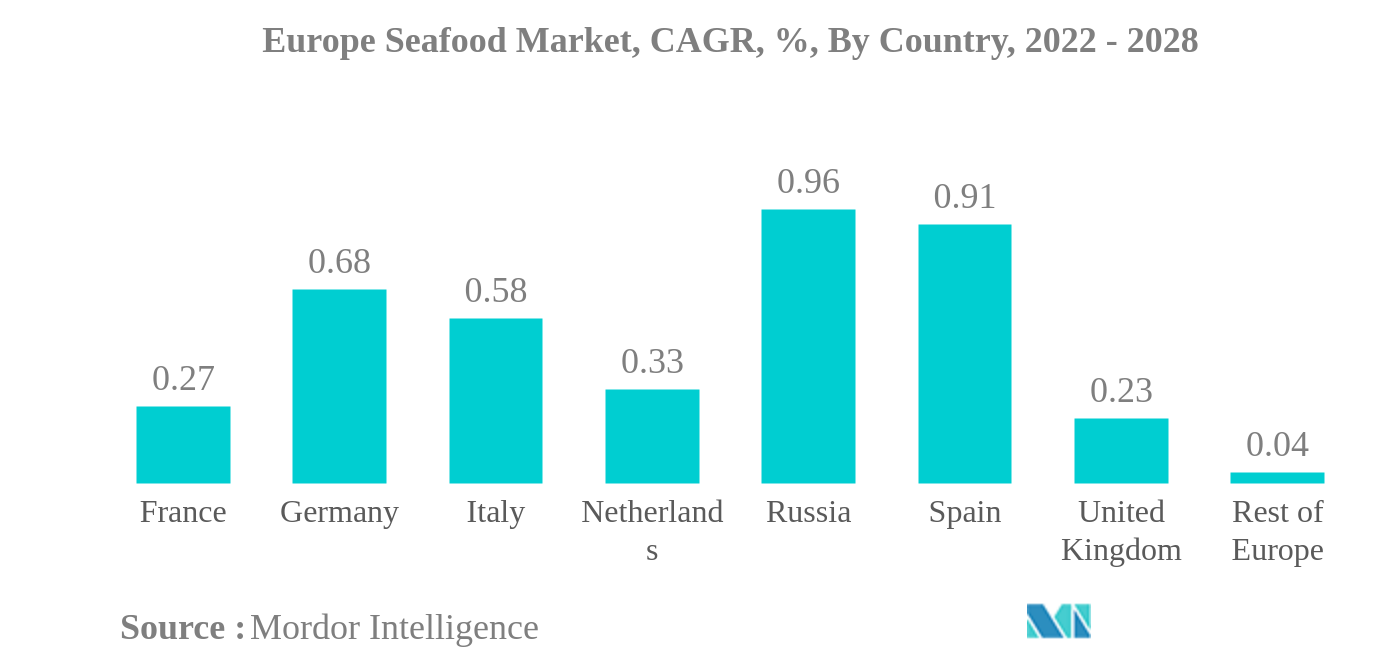
- France is the Largest Country : Seafood companies and suppliers in the region are constantly improving their product offerings in the seafood segment to cater to the high-income consumers in urban areas.
- Shrimp is the Fastest-growing Type : The consumption and supply of Pacific white shrimp are expanding across Europe, setting regional trends with distributors selling products derived from the variety.
- Russia is the Fastest-growing Country : The rise in demand for other seafood products like pollock in raw and processed forms drives the sales of seafood. Seafood processors may find it challenging due to the war.
Europe Seafood Market Trends
This section covers the major market trends shaping the Europe Seafood Market according to our research experts:
Fish is the largest Type
- The majority of seafood consumed in the region is fish, with tuna, cod, salmon, and Alaska pollock being the most popular fish species. Tuna is the most consumed seafood species in Europe, which is further increasing with the rise of Asian cuisine restaurants in the region. In 2019, tuna consumption in the European Union reached 3.07 kg per capita, from 2.78 kg per capita in 2018. Only 0.83% of the tuna consumed in Europe comes from farms, and 99.2% comes from wild catch.
- Fish is primarily consumed in the frozen/canned form in Europe, making up more than 66% of total consumption in 2021. The European canned seafood processing sector is mostly concentrated in Southern Europe, where Spain, Italy, France, and Portugal are the key players. Europe still imports canned fish from non-European nations to meet the domestic demand due to its high consumption.
- Shrimps are projected to register the highest CAGR, of 1.54%, in terms of value during the forecast period. Although quite small, the increase in the consumption of organic shrimp is predicted to pick up speed in the near future as consumers become more socially and ecologically conscious. In all the EU Member States, 94% of people in 2019 felt that environmental protection was essential to them. This has led to more than a 5% growth in the per capita consumption of shrimp in the region during the study period.
- The other seafood segment is witnessing increasing demand. However, in 2020, the impact of COVID-19 on the on-trade channel resulted in a decline in the Y-o-Y growth rate, reaching up to 1.66% compared to 3.11% in 2019 as a result of related issues. The oyster industry is suffering severely because the commerce of live oysters is now essentially impossible due to logistical issues.
France is the largest Country
- Apart from the rest of Europe, France accounted for the major market share for seafood in Europe during 2020-2021. Seafood sales in France increased by around 12%, in value, from 2018 to 2021. The country's per capita fish consumption is high owing to increasing consumer inclination toward seafood consumption. The growing seafood industries in France are anticipated to influence the seafood market during the forecast period.
- Seafood sales increased by around 35% in 2021 compared to the previous year. The sustained economic impact of the COVID-19 pandemic was reflected in the growth in fourth-quarter GDP. COVID-19 instances resulted in continuous restrictions and disruptions in the functioning of companies in several countries throughout the fourth quarter, which hampered the production of processed seafood. In 2021, once restrictions were eased, there were increased seafood sales in the region.
- Russia is expected to be the fastest-growing country, registering a CAGR of 0.96% during the forecast period (2022-2028), primarily driven by the increasing demand for processed shrimp and other seafood products. The Russian seafood industry is at a crossroads as large companies are beginning to invest more money and seek quotas from the country's government, while smaller companies oppose big changes in how quotas and the market are configured. In 2021, the Fishery Fleet Owners Association began seeking similar proposals to Frank's, which were supported by a new ally in late 2021, with multiple proposals, including the allocation of investment quotas for new ships and limiting the service life of fishing vessels and asking the government to distribute big investments in the sector.
Europe Seafood Industry Overview
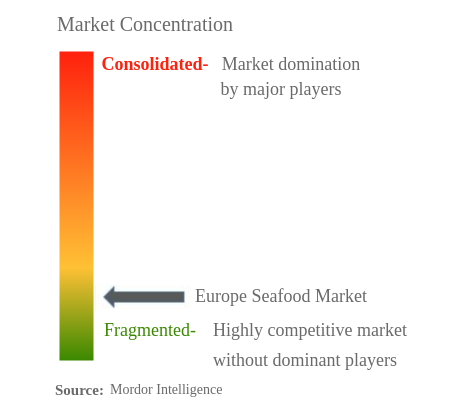
The Europe Seafood Market is fragmented, with the top five companies occupying 9.31%. The major players in this market are Austevoll Seafood ASA, Bolton Group SRL, Grieg Seafood ASA, Mowi ASA and Thai Union Group PCL (sorted alphabetically).
Europe Seafood Market Leaders
Austevoll Seafood ASA
Bolton Group SRL
Grieg Seafood ASA
Mowi ASA
Thai Union Group PCL
*Disclaimer: Major Players sorted in no particular order
Europe Seafood Market News
- June 2022: Royal Greenland and Espersen signed a new cooperation agreement enabling continued strong seafood category development based on production in Koszalin.
- May 2022: Royal Greenland established a new joint venture called Royal Fresh Fish GmbH in Cuxhaven with production facilities at Neufelder Strasse 37-41 to strengthen its production and market reach of the European fresh and re-fresh market.
- April 2022: Nomad Foods launched an Open Innovation Portal to accelerate food tech collaborations.
Europe Seafood Market Report - Table of Contents
1. INTRODUCTION
1.1. Study Assumptions & Market Definition
1.2. Scope of the Study
1.3. Research Methodology
2. KEY INDUSTRY TRENDS
2.1. Price Trends
2.2. Production Trends
2.3. Regulatory Framework
2.4. Value Chain & Distribution Channel Analysis
3. MARKET SEGMENTATION
3.1. Type
3.1.1. Fish
3.1.2. Shrimp
3.1.3. Other Seafood
3.2. Form
3.2.1. Fresh / Chilled
3.2.2. Frozen / Canned
3.2.3. Processed
3.3. Distribution Channel
3.3.1. Off-Trade
3.3.1.1. Convenience Stores
3.3.1.2. Online Channel
3.3.1.3. Supermarkets And Hypermarkets
3.3.1.4. Others
3.3.2. On-Trade
3.4. Country
3.4.1. France
3.4.2. Germany
3.4.3. Italy
3.4.4. Netherlands
3.4.5. Russia
3.4.6. Spain
3.4.7. United Kingdom
3.4.8. Rest Of Europe
4. COMPETITIVE LANDSCAPE
4.1. Key Strategic Moves
4.2. Market Share Analysis
4.3. Company Landscape
4.4. Company Profiles
4.4.1. Associated Seafoods Limited
4.4.2. Austevoll Seafood ASA
4.4.3. Bolton Group SRL
4.4.4. Grieg Seafood ASA
4.4.5. Iceland Seafood International hf
4.4.6. Kilic Seafood Co.
4.4.7. Mowi ASA
4.4.8. Nomad Foods Ltd
4.4.9. Nordic Seafood AS
4.4.10. Royal Greenland AS
4.4.11. Seafood King EU BV
4.4.12. Sofina Foods
4.4.13. Sykes Seafood Ltd
4.4.14. Thai Union Group PCL
5. KEY STRATEGIC QUESTIONS FOR SEAFOOD INDUSTRY CEOS
6. APPENDIX
6.1. Global Overview
6.1.1. Overview
6.1.2. Porter’s Five Forces Framework
6.1.3. Global Value Chain Analysis
6.1.4. Market Dynamics (DROs)
6.2. Sources & References
6.3. List of Tables & Figures
6.4. Primary Insights
6.5. Data Pack
6.6. Glossary of Terms
List of Tables & Figures
- Figure 1:
- EUROPE SEAFOOD MARKET, FISH, PRICE IN USD/METRIC TONNES, 2016 - 2022
- Figure 2:
- EUROPE SEAFOOD MARKET, SHRIMP, PRICE IN USD/METRIC TONNES, 2016 - 2022
- Figure 3:
- EUROPE SEAFOOD MARKET, FISH, PRODUCTION IN METRIC TONNES, 2016 - 2028
- Figure 4:
- EUROPE SEAFOOD MARKET, SHRIMP, PRODUCTION IN METRIC TONNES, 2016 - 2028
- Figure 5:
- EUROPE SEAFOOD MARKET, VOLUME, METRIC TONNES, 2016 - 2028
- Figure 6:
- EUROPE SEAFOOD MARKET, VALUE, USD, 2016 - 2028
- Figure 7:
- EUROPE SEAFOOD MARKET, VOLUME IN METRIC TONNES, BY TYPE, 2016 - 2028
- Figure 8:
- EUROPE SEAFOOD MARKET, VALUE IN USD, BY TYPE, 2016 - 2028
- Figure 9:
- EUROPE SEAFOOD MARKET, VOLUME SHARE (%), BY TYPE, 2016 VS 2022 VS 2028
- Figure 10:
- EUROPE SEAFOOD MARKET, VALUE SHARE (%), BY TYPE, 2016 VS 2022 VS 2028
- Figure 11:
- EUROPE SEAFOOD MARKET, VOLUME IN METRIC TONNES, FISH, 2016 - 2028
- Figure 12:
- EUROPE SEAFOOD MARKET, VALUE IN USD, FISH, 2016 - 2028
- Figure 13:
- EUROPE SEAFOOD MARKET, FISH, VALUE SHARE (%), BY DISTRIBUTION CHANNEL, 2021 VS 2028
- Figure 14:
- EUROPE SEAFOOD MARKET, VOLUME IN METRIC TONNES, SHRIMP, 2016 - 2028
- Figure 15:
- EUROPE SEAFOOD MARKET, VALUE IN USD, SHRIMP, 2016 - 2028
- Figure 16:
- EUROPE SEAFOOD MARKET, SHRIMP, VALUE SHARE (%), BY DISTRIBUTION CHANNEL, 2021 VS 2028
- Figure 17:
- EUROPE SEAFOOD MARKET, VOLUME IN METRIC TONNES, OTHER SEAFOOD, 2016 - 2028
- Figure 18:
- EUROPE SEAFOOD MARKET, VALUE IN USD, OTHER SEAFOOD, 2016 - 2028
- Figure 19:
- EUROPE SEAFOOD MARKET, OTHER SEAFOOD, VALUE SHARE (%), BY DISTRIBUTION CHANNEL, 2021 VS 2028
- Figure 20:
- EUROPE SEAFOOD MARKET, VOLUME IN METRIC TONNES, BY FORM, 2016 - 2028
- Figure 21:
- EUROPE SEAFOOD MARKET, VALUE IN USD, BY FORM, 2016 - 2028
- Figure 22:
- EUROPE SEAFOOD MARKET, VOLUME SHARE (%), BY FORM, 2016 VS 2022 VS 2028
- Figure 23:
- EUROPE SEAFOOD MARKET, VALUE SHARE (%), BY FORM, 2016 VS 2022 VS 2028
- Figure 24:
- EUROPE SEAFOOD MARKET, VOLUME IN METRIC TONNES, FRESH / CHILLED, 2016 - 2028
- Figure 25:
- EUROPE SEAFOOD MARKET, VALUE IN USD, FRESH / CHILLED, 2016 - 2028
- Figure 26:
- EUROPE SEAFOOD MARKET, FRESH / CHILLED, VALUE SHARE (%), BY TYPE, 2021 VS 2028
- Figure 27:
- EUROPE SEAFOOD MARKET, VOLUME IN METRIC TONNES, FROZEN / CANNED, 2016 - 2028
- Figure 28:
- EUROPE SEAFOOD MARKET, VALUE IN USD, FROZEN / CANNED, 2016 - 2028
- Figure 29:
- EUROPE SEAFOOD MARKET, FROZEN / CANNED, VALUE SHARE (%), BY TYPE, 2021 VS 2028
- Figure 30:
- EUROPE SEAFOOD MARKET, VOLUME IN METRIC TONNES, PROCESSED, 2016 - 2028
- Figure 31:
- EUROPE SEAFOOD MARKET, VALUE IN USD, PROCESSED, 2016 - 2028
- Figure 32:
- EUROPE SEAFOOD MARKET, PROCESSED, VALUE SHARE (%), BY TYPE, 2021 VS 2028
- Figure 33:
- EUROPE SEAFOOD MARKET, VOLUME IN METRIC TONNES, BY DISTRIBUTION CHANNEL, 2016 - 2028
- Figure 34:
- EUROPE SEAFOOD MARKET, VALUE IN USD, BY DISTRIBUTION CHANNEL, 2016 - 2028
- Figure 35:
- EUROPE SEAFOOD MARKET, VOLUME SHARE (%), BY DISTRIBUTION CHANNEL, 2016 VS 2022 VS 2028
- Figure 36:
- EUROPE SEAFOOD MARKET, VALUE SHARE (%), BY DISTRIBUTION CHANNEL, 2016 VS 2022 VS 2028
- Figure 37:
- EUROPE SEAFOOD MARKET, VOLUME IN METRIC TONNES, BY OFF-TRADE, 2016 - 2028
- Figure 38:
- EUROPE SEAFOOD MARKET, VALUE IN USD, BY OFF-TRADE, 2016 - 2028
- Figure 39:
- EUROPE SEAFOOD MARKET, VOLUME SHARE (%), BY OFF-TRADE, 2016 VS 2022 VS 2028
- Figure 40:
- EUROPE SEAFOOD MARKET, VALUE SHARE (%), BY OFF-TRADE, 2016 VS 2022 VS 2028
- Figure 41:
- EUROPE SEAFOOD MARKET, VOLUME IN METRIC TONNES, CONVENIENCE STORES, 2016 - 2028
- Figure 42:
- EUROPE SEAFOOD MARKET, VALUE IN USD, CONVENIENCE STORES, 2016 - 2028
- Figure 43:
- EUROPE SEAFOOD MARKET, CONVENIENCE STORES, VALUE SHARE (%), BY TYPE, 2021 VS 2028
- Figure 44:
- EUROPE SEAFOOD MARKET, VOLUME IN METRIC TONNES, ONLINE CHANNEL, 2016 - 2028
- Figure 45:
- EUROPE SEAFOOD MARKET, VALUE IN USD, ONLINE CHANNEL, 2016 - 2028
- Figure 46:
- EUROPE SEAFOOD MARKET, ONLINE CHANNEL, VALUE SHARE (%), BY TYPE, 2021 VS 2028
- Figure 47:
- EUROPE SEAFOOD MARKET, VOLUME IN METRIC TONNES, SUPERMARKETS AND HYPERMARKETS, 2016 - 2028
- Figure 48:
- EUROPE SEAFOOD MARKET, VALUE IN USD, SUPERMARKETS AND HYPERMARKETS, 2016 - 2028
- Figure 49:
- EUROPE SEAFOOD MARKET, SUPERMARKETS AND HYPERMARKETS, VALUE SHARE (%), BY TYPE, 2021 VS 2028
- Figure 50:
- EUROPE SEAFOOD MARKET, VOLUME IN METRIC TONNES, OTHERS, 2016 - 2028
- Figure 51:
- EUROPE SEAFOOD MARKET, VALUE IN USD, OTHERS, 2016 - 2028
- Figure 52:
- EUROPE SEAFOOD MARKET, OTHERS, VALUE SHARE (%), BY TYPE, 2021 VS 2028
- Figure 53:
- EUROPE SEAFOOD MARKET, VOLUME IN METRIC TONNES, ON-TRADE, 2016 - 2028
- Figure 54:
- EUROPE SEAFOOD MARKET, VALUE IN USD, ON-TRADE, 2016 - 2028
- Figure 55:
- EUROPE SEAFOOD MARKET, VOLUME IN METRIC TONNES, BY COUNTRY, 2016 - 2028
- Figure 56:
- EUROPE SEAFOOD MARKET, VALUE IN USD, BY COUNTRY, 2016 - 2028
- Figure 57:
- EUROPE SEAFOOD MARKET, VOLUME SHARE (%), BY COUNTRY, 2016 VS 2022 VS 2028
- Figure 58:
- EUROPE SEAFOOD MARKET, VOLUME SHARE (%), BY COUNTRY, 2016 VS 2022 VS 2028
- Figure 59:
- EUROPE SEAFOOD MARKET, VOLUME IN METRIC TONNES, FRANCE, 2016 - 2028
- Figure 60:
- EUROPE SEAFOOD MARKET, VALUE IN USD, FRANCE, 2016 - 2028
- Figure 61:
- EUROPE SEAFOOD MARKET, FRANCE, VALUE SHARE (%), BY DISTRIBUTION CHANNEL, 2021 VS 2028
- Figure 62:
- EUROPE SEAFOOD MARKET, VOLUME IN METRIC TONNES, GERMANY, 2016 - 2028
- Figure 63:
- EUROPE SEAFOOD MARKET, VALUE IN USD, GERMANY, 2016 - 2028
- Figure 64:
- EUROPE SEAFOOD MARKET, GERMANY, VALUE SHARE (%), BY DISTRIBUTION CHANNEL, 2021 VS 2028
- Figure 65:
- EUROPE SEAFOOD MARKET, VOLUME IN METRIC TONNES, ITALY, 2016 - 2028
- Figure 66:
- EUROPE SEAFOOD MARKET, VALUE IN USD, ITALY, 2016 - 2028
- Figure 67:
- EUROPE SEAFOOD MARKET, ITALY, VALUE SHARE (%), BY DISTRIBUTION CHANNEL, 2021 VS 2028
- Figure 68:
- EUROPE SEAFOOD MARKET, VOLUME IN METRIC TONNES, NETHERLANDS, 2016 - 2028
- Figure 69:
- EUROPE SEAFOOD MARKET, VALUE IN USD, NETHERLANDS, 2016 - 2028
- Figure 70:
- EUROPE SEAFOOD MARKET, NETHERLANDS, VALUE SHARE (%), BY DISTRIBUTION CHANNEL, 2021 VS 2028
- Figure 71:
- EUROPE SEAFOOD MARKET, VOLUME IN METRIC TONNES, RUSSIA, 2016 - 2028
- Figure 72:
- EUROPE SEAFOOD MARKET, VALUE IN USD, RUSSIA, 2016 - 2028
- Figure 73:
- EUROPE SEAFOOD MARKET, RUSSIA, VALUE SHARE (%), BY DISTRIBUTION CHANNEL, 2021 VS 2028
- Figure 74:
- EUROPE SEAFOOD MARKET, VOLUME IN METRIC TONNES, SPAIN, 2016 - 2028
- Figure 75:
- EUROPE SEAFOOD MARKET, VALUE IN USD, SPAIN, 2016 - 2028
- Figure 76:
- EUROPE SEAFOOD MARKET, SPAIN, VALUE SHARE (%), BY DISTRIBUTION CHANNEL, 2021 VS 2028
- Figure 77:
- EUROPE SEAFOOD MARKET, VOLUME IN METRIC TONNES, UNITED KINGDOM, 2016 - 2028
- Figure 78:
- EUROPE SEAFOOD MARKET, VALUE IN USD, UNITED KINGDOM, 2016 - 2028
- Figure 79:
- EUROPE SEAFOOD MARKET, UNITED KINGDOM, VALUE SHARE (%), BY DISTRIBUTION CHANNEL, 2021 VS 2028
- Figure 80:
- EUROPE SEAFOOD MARKET, VOLUME IN METRIC TONNES, REST OF EUROPE, 2016 - 2028
- Figure 81:
- EUROPE SEAFOOD MARKET, VALUE IN USD, REST OF EUROPE, 2016 - 2028
- Figure 82:
- EUROPE SEAFOOD MARKET, REST OF EUROPE, VALUE SHARE (%), BY DISTRIBUTION CHANNEL, 2021 VS 2028
- Figure 83:
- EUROPE SEAFOOD MARKET, MOST ACTIVE COMPANIES, BY NUMBER OF STRATEGIC MOVES, 2017 - 2022
- Figure 84:
- EUROPE SEAFOOD MARKET, TOTAL NUMBER OF STRATEGIC MOVES, 2017 - 2022
- Figure 85:
- EUROPE SEAFOOD MARKET SHARE(%), BY KEY PLAYERS, 2021
Europe Seafood Industry Segmentation
Fish, Shrimp are covered as segments by Type. Fresh / Chilled, Frozen / Canned, Processed are covered as segments by Form. Off-Trade, On-Trade are covered as segments by Distribution Channel. France, Germany, Italy, Netherlands, Russia, Spain, United Kingdom are covered as segments by Country.| Type | |
| Fish | |
| Shrimp | |
| Other Seafood |
| Form | |
| Fresh / Chilled | |
| Frozen / Canned | |
| Processed |
| Distribution Channel | ||||||
| ||||||
| On-Trade |
| Country | |
| France | |
| Germany | |
| Italy | |
| Netherlands | |
| Russia | |
| Spain | |
| United Kingdom | |
| Rest Of Europe |
Market Definition
- Frozen / Canned Seafood - Frozen seafood are products whose average temperature is reduced to -18 ° C or lower to preserve the inherent quality of the fresh fish. Then it is kept at a temperature of -18 ° C or lower to maintain its shelf life.
- Processed Seafood - Processed seafood are the ones that have been cured, salted, marinated, dried, pickled, fermented or smoked for human consumption.
- Seafood - It contains marine species that can be consumed, particularly fish and shelled marine life.
- Shrimp - Shrimp are swimming crustaceans. They have long, slender muscles in their abdomens and lengthy antennae.
Research Methodology
Mordor Intelligence follows a four-step methodology in all our reports.
- Step-1: Identify Key Variables: In order to build a robust forecasting methodology, the variables and factors identified in Step 1 are tested against available historical market numbers. Through an iterative process, the variables required for market forecast are set, and the model is built on the basis of these variables.
- Step-2: Build a Market Model: Market-size estimations for the forecast years are in nominal terms. Inflation is not a part of the pricing, and the average selling price (ASP) is kept constant throughout the forecast period for each country.
- Step-3: Validate and Finalize: In this important step, all market numbers, variables, and analyst calls are validated through an extensive network of primary research experts from the market studied. The respondents are selected across levels and functions to generate a holistic picture of the market studied.
- Step-4: Research Outputs: Syndicated Reports, Custom Consulting Assignments, Databases & Subscription Platforms


