Europe Biopesticides Market Size

| Icons | Lable | Value |
|---|---|---|
|
|
Study Period | 2017 - 2029 |
|
|
Base Year For Estimation | 2022 |
|
|
CAGR | 10.08 % |
|
|
Largest Share by Form | Biofungicides |
|
|
Largest Share by Country | France |
|
|
Market Concentration | High |
Major Players |
||
|
|
||
|
*Disclaimer: Major Players sorted in no particular order |
Europe Biopesticides Market Analysis
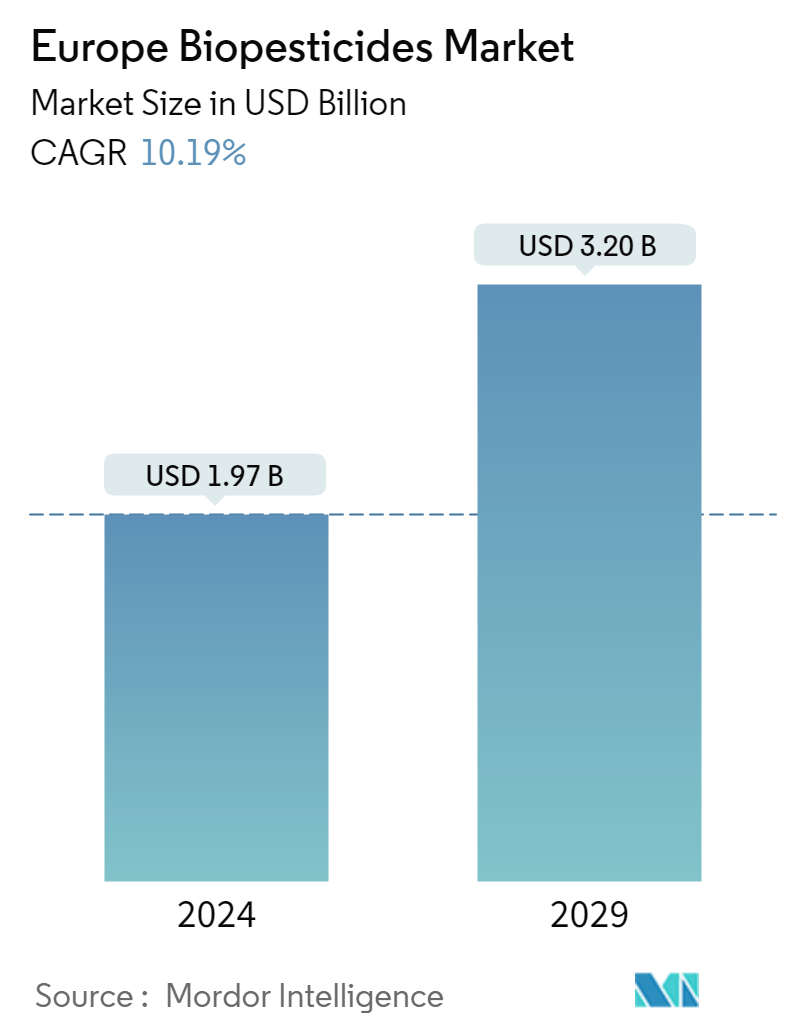
The Europe Biopesticides Market is projected to register a CAGR of 10.08%
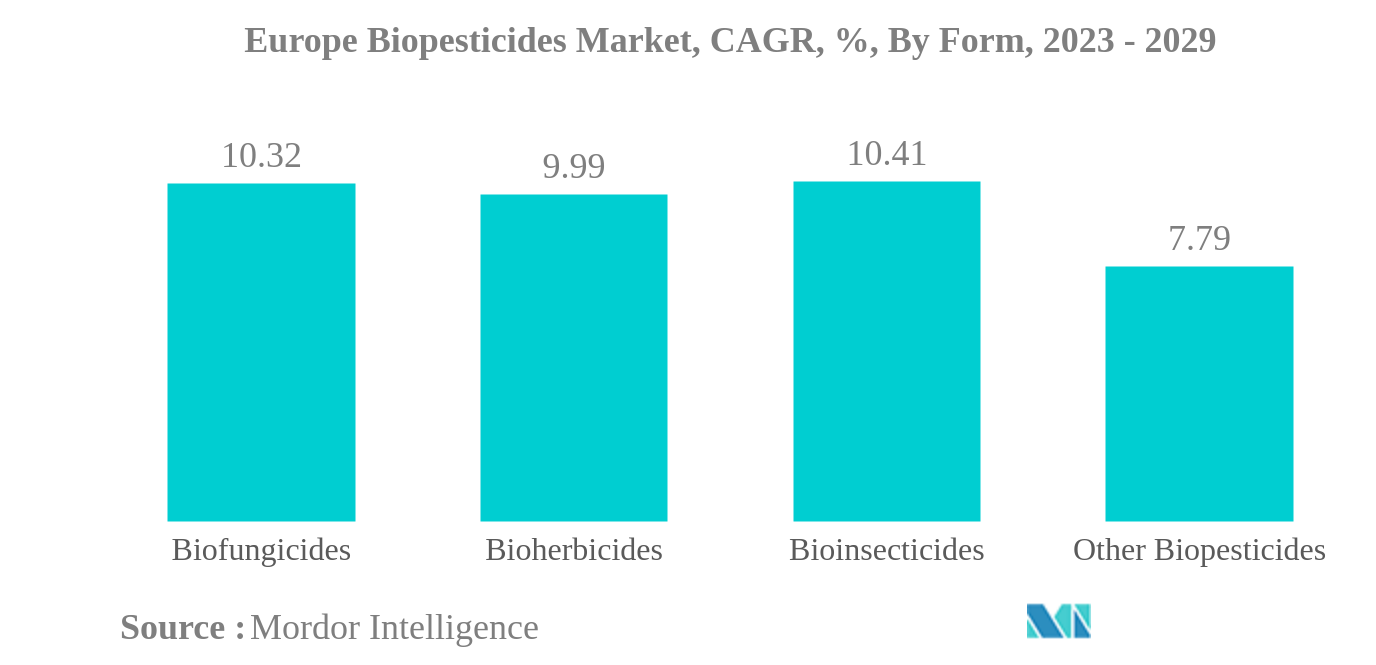
- Biofungicides is the Largest Form : Bio fungicides is a formulation applied to control the activity of plant pathogenic fungi that cause plant diseases. Bio fungicides may be of microbial or botanical origin.
- Bioinsecticides is the Fastest-growing Form : Bioinsecticides are derived from fungi, bacteria, or plant extracts to combat pest insects. Field crops dominated the bioinsecticides market with a share of 77.9% in 2022.
- Row Crops is the Largest Crop Type : Wheat, maize, corn, barley, and oats are the most important row crops grown in the European region. In 2022, biofungicides accounted for about 45.6% of the market volume.
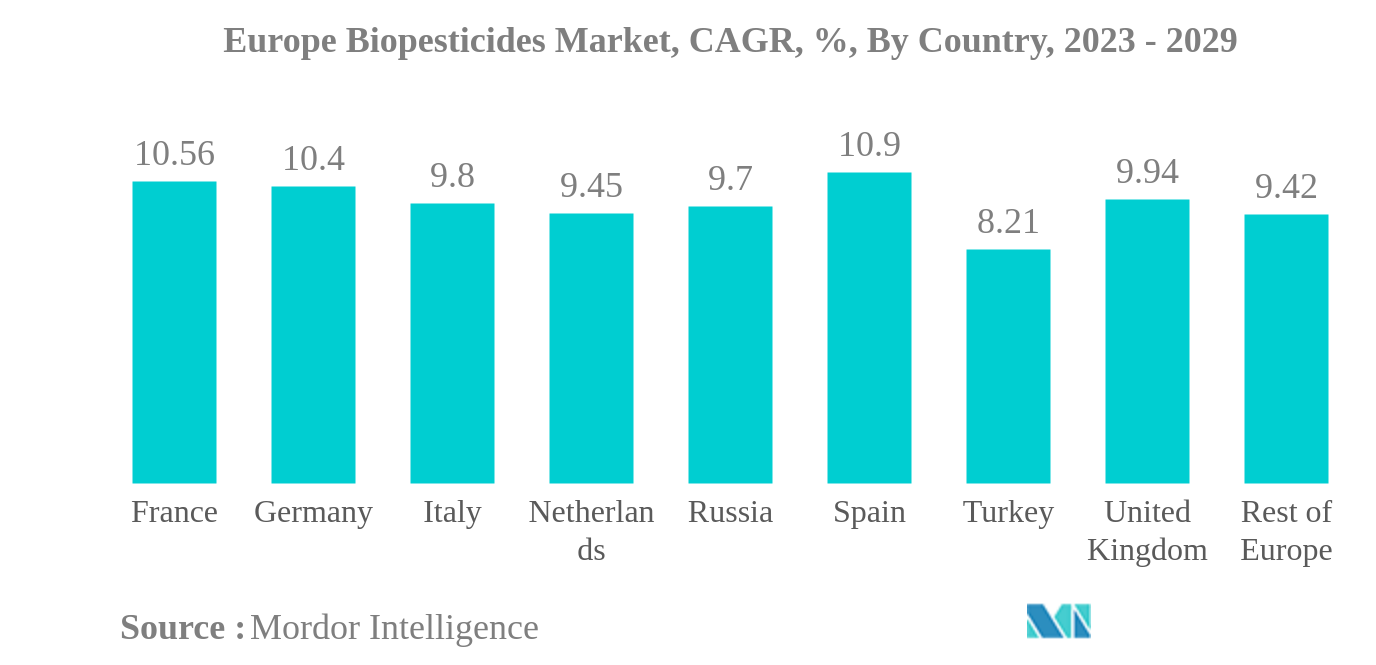
- France is the Largest Country : France is the largest market for biopesticides in Europe. Biofungicides are the most consumed type in crop cultivation with a volume share of 49.5% in the year 2022.
Europe Biopesticides Market Trends
This section covers the major market trends shaping the Europe Biopesticides Market according to our research experts:
Biofungicides is the largest Form
- Biopesticides are naturally occurring substances or agents derived from animals, plants, insects, and microorganisms, including bacteria and fungi, which are used to manage agricultural pests and infections. In 2022, the European biopesticides market accounted for about 77.9% of the global crop protection market by value.
- The European biopesticides market value increased by about 31.2% during the historical period (2017-2022). The market value is anticipated to increase by about 77.9% and reach USD 3.20 billion by the end of the forecast period. While the prevalence of chemical or synthetic pesticides in crop protection is continuing, human and animal health concerns are playing key roles in driving the growth of biopesticides.
- The biopesticides market is dominated by field crops, which accounted for a 78.6% share, valued at about USD 1.28 billion in 2022. The dominance of field crops is mainly due to its large cultivation area in the region, which accounted for about 81.2% of the total organic crop cultivation area in 2022.
- Biofungicides dominate the European biopesticides market. The segment held a market share of 59.3% in 2022, valued at USD 971.3 million.
- The European Green Deal set the challenging goal of reducing the use and risk of chemical pesticides by 50% in 2030. IPM strategies are likely to be used, which are based on a holistic view of agroecosystems, with the goal of developing pest- and disease-resistant cropping systems that primarily employ non-chemical pest management measures. They also promote Integrated Pest Management (IPM) tools, which assist farmers in finding the required solutions. Such factors and the growing trend of farmers transitioning to organic agriculture are expected to drive the European biopesticides market during the forecast period.
France is the largest Country
- The European biopesticides market may grow in the coming years, owing to a shift toward sustainable agricultural practices and increasing demand for organic products. France dominated the market with a 19.1% share in 2022, as French farmers used biopesticides to reduce reliance on chemical inputs in agriculture, aligning with the country's public policy objectives.
- Italy is the second-largest market for biopesticides in Europe. It is projected to grow by 75.2%, with a CAGR of 9.8% during the forecast period. Recently, the European Commission has endorsed four legal acts that simplify the approval and authorization process of biological plant protection products containing microorganisms, which are expected to provide farmers with tools to substitute chemical plant protection products and support the objectives of the Farm-to-Fork Strategy.
- Organic farming is a key sector of EU agriculture, with almost 330,000 organic farmers in the European Union in 2019 and a 20% share of the farming area in the Member States. The Farm-to-Fork Strategy aims to increase the total farmland under organic farming in the European Union to at least 25% by 2030, providing opportunities for sustainable alternatives to control plant pests.
- The rising product launches and government support for the use of biopesticides are expected to significantly impact the market in the coming years, with the potential for continued growth and innovation in sustainable agricultural solutions. As the market evolves, industry players must keep up with changing consumer preferences and regulatory requirements and invest in R&D to meet the growing demand for sustainable agricultural solutions.
Europe Biopesticides Industry Overview
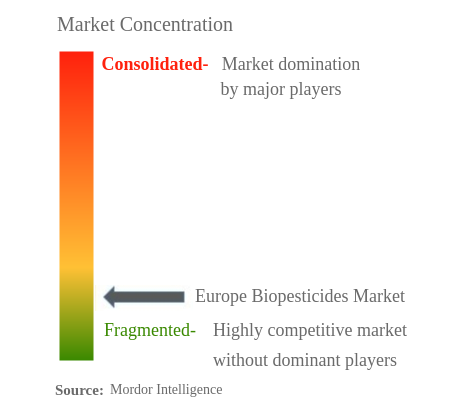
The Europe Biopesticides Market is fragmented, with the top five companies occupying 2.67%. The major players in this market are Certis U.S.A. L.L.C., Corteva Agriscience, Koppert Biological Systems Inc., Seipasa, SA and Valent Biosciences LLC (sorted alphabetically).
Europe Biopesticides Market Leaders
Certis U.S.A. L.L.C.
Corteva Agriscience
Koppert Biological Systems Inc.
Seipasa, SA
Valent Biosciences LLC
*Disclaimer: Major Players sorted in no particular order
Europe Biopesticides Market News
- October 2022: Seipasa launched its new advanced biofungicidal product, "Fungisei," in France, after getting registered phytosaniritarily by the European Commission.
- September 2022: Corteva Agriscience signed an agreement to acquire Symborg, a biologicals-based company, as a part of its strategy to expand its biologicals portfolio. The move was aimed at helping Corteva Agriscience in achieving its aim to become a global leader in the agricultural biologicals market.
- June 2022: Certis Biologicals and Novozymes, two leading agricultural biotechnology companies, collaborated to develop new technologies for highly effective fungal disease control. This collaboration will provide new solutions to row crop growers.
Europe Biopesticides Market Report - Table of Contents
EXECUTIVE SUMMARY & KEY FINDINGS
REPORT OFFERS
1. INTRODUCTION
1.1. Study Assumptions & Market Definition
1.2. Scope of the Study
1.3. Research Methodology
2. KEY INDUSTRY TRENDS
2.1. Area Under Organic Cultivation
2.2. Per Capita Spending On Organic Products
2.3. Regulatory Framework
2.4. Value Chain & Distribution Channel Analysis
3. MARKET SEGMENTATION
3.1. Form
3.1.1. Biofungicides
3.1.2. Bioherbicides
3.1.3. Bioinsecticides
3.1.4. Other Biopesticides
3.2. Crop Type
3.2.1. Cash Crops
3.2.2. Horticultural Crops
3.2.3. Row Crops
3.3. Country
3.3.1. France
3.3.2. Germany
3.3.3. Italy
3.3.4. Netherlands
3.3.5. Russia
3.3.6. Spain
3.3.7. Turkey
3.3.8. United Kingdom
3.3.9. Rest Of Europe
4. COMPETITIVE LANDSCAPE
4.1. Key Strategic Moves
4.2. Market Share Analysis
4.3. Company Landscape
4.4. Company Profiles
4.4.1. Andermatt Group AG
4.4.2. Atlántica Agrícola
4.4.3. Biolchim SPA
4.4.4. Bionema
4.4.5. Certis U.S.A. L.L.C.
4.4.6. Corteva Agriscience
4.4.7. Koppert Biological Systems Inc.
4.4.8. Lallemand Inc.
4.4.9. Seipasa, SA
4.4.10. Valent Biosciences LLC
5. KEY STRATEGIC QUESTIONS FOR AGRICULTURAL BIOLOGICALS CEOS
6. APPENDIX
6.1. Global Overview
6.1.1. Overview
6.1.2. Porter’s Five Forces Framework
6.1.3. Global Value Chain Analysis
6.1.4. Market Dynamics (DROs)
6.2. Sources & References
6.3. List of Tables & Figures
6.4. Primary Insights
6.5. Data Pack
6.6. Glossary of Terms
List of Tables & Figures
- Figure 1:
- EUROPE BIOPESTICIDES MARKET, AREA UNDER ORGANIC CULTIVATION, HECTARES, 2017 - 2022
- Figure 2:
- EUROPE BIOPESTICIDES MARKET, PER CAPITA SPENDING ON ORGANIC PRODUCTS, USD, 2017 - 2022
- Figure 3:
- EUROPE BIOPESTICIDES MARKET, VOLUME, METRIC TON, 2017 - 2029
- Figure 4:
- EUROPE BIOPESTICIDES MARKET, VALUE, USD, 2017 - 2029
- Figure 5:
- EUROPE BIOPESTICIDES MARKET, BY FORM, VOLUME, METRIC TON, 2017 - 2029
- Figure 6:
- EUROPE BIOPESTICIDES MARKET, BY FORM, VALUE, USD, 2017 - 2029
- Figure 7:
- EUROPE BIOPESTICIDES MARKET, VOLUME SHARE(%), BY FORM, 2017 - 2029
- Figure 8:
- EUROPE BIOPESTICIDES MARKET, VALUE SHARE(%), BY FORM, 2017 - 2029
- Figure 9:
- EUROPE BIOPESTICIDES MARKET, BY FORM, VOLUME, METRIC TON, 2017 - 2029
- Figure 10:
- EUROPE BIOPESTICIDES MARKET, BY FORM, VALUE, USD, 2017 - 2029
- Figure 11:
- EUROPE BIOPESTICIDES MARKET, VALUE SHARE(%), BY CROP TYPE, 2022 - 2029
- Figure 12:
- EUROPE BIOPESTICIDES MARKET, BY FORM, VOLUME, METRIC TON, 2017 - 2029
- Figure 13:
- EUROPE BIOPESTICIDES MARKET, BY FORM, VALUE, USD, 2017 - 2029
- Figure 14:
- EUROPE BIOPESTICIDES MARKET, VALUE SHARE(%), BY CROP TYPE, 2022 - 2029
- Figure 15:
- EUROPE BIOPESTICIDES MARKET, BY FORM, VOLUME, METRIC TON, 2017 - 2029
- Figure 16:
- EUROPE BIOPESTICIDES MARKET, BY FORM, VALUE, USD, 2017 - 2029
- Figure 17:
- EUROPE BIOPESTICIDES MARKET, VALUE SHARE(%), BY CROP TYPE, 2022 - 2029
- Figure 18:
- EUROPE BIOPESTICIDES MARKET, BY FORM, VOLUME, METRIC TON, 2017 - 2029
- Figure 19:
- EUROPE BIOPESTICIDES MARKET, BY FORM, VALUE, USD, 2017 - 2029
- Figure 20:
- EUROPE BIOPESTICIDES MARKET, VALUE SHARE(%), BY CROP TYPE, 2022 - 2029
- Figure 21:
- EUROPE BIOPESTICIDES MARKET, BY CROP TYPE, VOLUME, METRIC TON, 2017 - 2029
- Figure 22:
- EUROPE BIOPESTICIDES MARKET, BY CROP TYPE, VALUE, USD, 2017 - 2029
- Figure 23:
- EUROPE BIOPESTICIDES MARKET, VOLUME SHARE(%), BY CROP TYPE, 2017 - 2029
- Figure 24:
- EUROPE BIOPESTICIDES MARKET, VALUE SHARE(%), BY CROP TYPE, 2017 - 2029
- Figure 25:
- EUROPE BIOPESTICIDES MARKET, BY CROP TYPE, VOLUME, METRIC TON, 2017 - 2029
- Figure 26:
- EUROPE BIOPESTICIDES MARKET, BY CROP TYPE, VALUE, USD, 2017 - 2029
- Figure 27:
- EUROPE BIOPESTICIDES MARKET, VALUE SHARE(%), BY FORM, 2022 - 2029
- Figure 28:
- EUROPE BIOPESTICIDES MARKET, BY CROP TYPE, VOLUME, METRIC TON, 2017 - 2029
- Figure 29:
- EUROPE BIOPESTICIDES MARKET, BY CROP TYPE, VALUE, USD, 2017 - 2029
- Figure 30:
- EUROPE BIOPESTICIDES MARKET, VALUE SHARE(%), BY FORM, 2022 - 2029
- Figure 31:
- EUROPE BIOPESTICIDES MARKET, BY CROP TYPE, VOLUME, METRIC TON, 2017 - 2029
- Figure 32:
- EUROPE BIOPESTICIDES MARKET, BY CROP TYPE, VALUE, USD, 2017 - 2029
- Figure 33:
- EUROPE BIOPESTICIDES MARKET, VALUE SHARE(%), BY FORM, 2022 - 2029
- Figure 34:
- EUROPE BIOPESTICIDES MARKET, BY COUNTRY, VOLUME, METRIC TON, 2017 - 2029
- Figure 35:
- EUROPE BIOPESTICIDES MARKET, BY COUNTRY, VALUE, USD, 2017 - 2029
- Figure 36:
- EUROPE BIOPESTICIDES MARKET, VOLUME SHARE(%), BY COUNTRY, 2017 - 2029
- Figure 37:
- EUROPE BIOPESTICIDES MARKET, VALUE SHARE(%), BY COUNTRY, 2017 - 2029
- Figure 38:
- EUROPE BIOPESTICIDES MARKET, BY COUNTRY, VOLUME, METRIC TON, 2017 - 2029
- Figure 39:
- EUROPE BIOPESTICIDES MARKET, BY COUNTRY, VALUE, USD, 2017 - 2029
- Figure 40:
- EUROPE BIOPESTICIDES MARKET, VALUE SHARE(%), BY FORM, 2022 - 2029
- Figure 41:
- EUROPE BIOPESTICIDES MARKET, BY COUNTRY, VOLUME, METRIC TON, 2017 - 2029
- Figure 42:
- EUROPE BIOPESTICIDES MARKET, BY COUNTRY, VALUE, USD, 2017 - 2029
- Figure 43:
- EUROPE BIOPESTICIDES MARKET, VALUE SHARE(%), BY FORM, 2022 - 2029
- Figure 44:
- EUROPE BIOPESTICIDES MARKET, BY COUNTRY, VOLUME, METRIC TON, 2017 - 2029
- Figure 45:
- EUROPE BIOPESTICIDES MARKET, BY COUNTRY, VALUE, USD, 2017 - 2029
- Figure 46:
- EUROPE BIOPESTICIDES MARKET, VALUE SHARE(%), BY FORM, 2022 - 2029
- Figure 47:
- EUROPE BIOPESTICIDES MARKET, BY COUNTRY, VOLUME, METRIC TON, 2017 - 2029
- Figure 48:
- EUROPE BIOPESTICIDES MARKET, BY COUNTRY, VALUE, USD, 2017 - 2029
- Figure 49:
- EUROPE BIOPESTICIDES MARKET, VALUE SHARE(%), BY FORM, 2022 - 2029
- Figure 50:
- EUROPE BIOPESTICIDES MARKET, BY COUNTRY, VOLUME, METRIC TON, 2017 - 2029
- Figure 51:
- EUROPE BIOPESTICIDES MARKET, BY COUNTRY, VALUE, USD, 2017 - 2029
- Figure 52:
- EUROPE BIOPESTICIDES MARKET, VALUE SHARE(%), BY FORM, 2022 - 2029
- Figure 53:
- EUROPE BIOPESTICIDES MARKET, BY COUNTRY, VOLUME, METRIC TON, 2017 - 2029
- Figure 54:
- EUROPE BIOPESTICIDES MARKET, BY COUNTRY, VALUE, USD, 2017 - 2029
- Figure 55:
- EUROPE BIOPESTICIDES MARKET, VALUE SHARE(%), BY FORM, 2022 - 2029
- Figure 56:
- EUROPE BIOPESTICIDES MARKET, BY COUNTRY, VOLUME, METRIC TON, 2017 - 2029
- Figure 57:
- EUROPE BIOPESTICIDES MARKET, BY COUNTRY, VALUE, USD, 2017 - 2029
- Figure 58:
- EUROPE BIOPESTICIDES MARKET, VALUE SHARE(%), BY FORM, 2022 - 2029
- Figure 59:
- EUROPE BIOPESTICIDES MARKET, BY COUNTRY, VOLUME, METRIC TON, 2017 - 2029
- Figure 60:
- EUROPE BIOPESTICIDES MARKET, BY COUNTRY, VALUE, USD, 2017 - 2029
- Figure 61:
- EUROPE BIOPESTICIDES MARKET, VALUE SHARE(%), BY FORM, 2022 - 2029
- Figure 62:
- EUROPE BIOPESTICIDES MARKET, BY COUNTRY, VOLUME, METRIC TON, 2017 - 2029
- Figure 63:
- EUROPE BIOPESTICIDES MARKET, BY COUNTRY, VALUE, USD, 2017 - 2029
- Figure 64:
- EUROPE BIOPESTICIDES MARKET, VALUE SHARE(%), BY FORM, 2022 - 2029
- Figure 65:
- EUROPE BIOPESTICIDES MARKET, MOST ACTIVE COMPANIES, BY NUMBER OF STRATEGIC MOVES, 2017-2022
- Figure 66:
- EUROPE BIOPESTICIDES MARKET, MOST ADOPTED STRATEGIES, 2017-2022
- Figure 67:
- EUROPE BIOPESTICIDES MARKET SHARE(%), BY MAJOR PLAYERS, 2022
Europe Biopesticides Industry Segmentation
Biofungicides, Bioherbicides, Bioinsecticides are covered as segments by Form. Cash Crops, Horticultural Crops, Row Crops are covered as segments by Crop Type. France, Germany, Italy, Netherlands, Russia, Spain, Turkey, United Kingdom are covered as segments by Country.| Form | |
| Biofungicides | |
| Bioherbicides | |
| Bioinsecticides | |
| Other Biopesticides |
| Crop Type | |
| Cash Crops | |
| Horticultural Crops | |
| Row Crops |
| Country | |
| France | |
| Germany | |
| Italy | |
| Netherlands | |
| Russia | |
| Spain | |
| Turkey | |
| United Kingdom | |
| Rest Of Europe |
Market Definition
- AVERAGE DOSAGE RATE - This refers to the average volume of biopesticides applied per hectare of farmland in the respective region/country.
- CROP TYPE - Row Crops: Cereals, Pulses, Oilseeds, and Forage Crops Horticulture: Fruits, and Vegetables, Cash Crops: Plantation Crops and Spices.
- FUNCTIONS - Biopesticides
- MARKET ESTIMATION LEVEL - Market Estimations for various types of biopesticides has been done at the product-level.
Research Methodology
Mordor Intelligence follows a four-step methodology in all our reports.
- Step-1: Identify Key Variables: In order to build a robust forecasting methodology, the variables and factors identified in Step-1 are tested against available historical market numbers. Through an iterative process, the variables required for market forecast are set and the model is built on the basis of these variables.
- Step-2: Build a Market Model: Market-size estimations for the forecast years are in nominal terms. Inflation is not a part of the pricing, and the average selling price (ASP) is kept constant throughout the forecast period.
- Step-3: Validate and Finalize: In this important step, all market numbers, variables and analyst calls are validated through an extensive network of primary research experts from the market studied. The respondents are selected across levels and functions to generate a holistic picture of the market studied.
- Step-4: Research Outputs: Syndicated Reports, Custom Consulting Assignments, Databases & Subscription Platforms.


