Mexico Data Center Market Size

| Icons | Lable | Value |
|---|---|---|
|
|
Study Period | 2017 - 2029 |
|
|
Base Year For Estimation | 2022 |
|
|
CAGR | 7.13 % |
|
|
Largest Share by Tier Type | Tier 4 |
|
|
Fastest Growing by Tier Type | Tier 4 |
|
|
Market Concentration | High |
Major Players |
||
|
|
||
|
*Disclaimer: Major Players sorted in no particular order |
Mexico Data Center Market Analysis
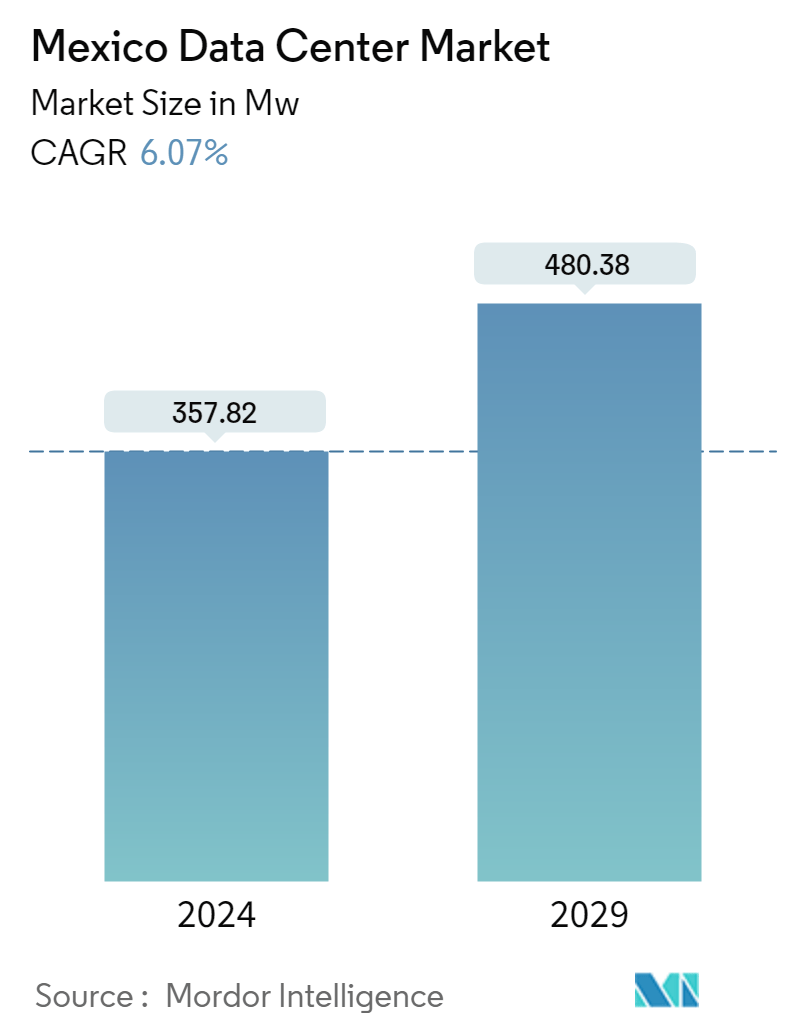
The Mexico Data Center Market is projected to register a CAGR of 7.13%
- IT Load Capacity: The IT load capacity of the data center market will have steady growth and is expected to reach 480.3 MW by 2029.
- Raised Floor Space: The total raised floor area of the country is expected to increase to 2.4 million sq. ft by 2029.
- Installed Racks: The number of installed racks is expected to reach 120,094 units by 2029. Querétaro is expected to house the maximum number of racks by 2029.
- DC Facilities: There are 18 colocation data center facilities in Mexico. Querétaro and Guadalajara are the major hotspots in the country. The increasing adoption of the cloud by most businesses is among the factors boosting the number of data centers in the nation.
- Leading Market Player: Telmex (América Móvil) has five data center facilities in Mexico. These facilities have a 477,744 sq. ft net rentable capacity and an operating capacity of 144.02 MW IT load capacity, with more than 23,887 units of racks.
Mexico Data Center Market Trends
This section covers the major market trends shaping the Mexico Data Center Market according to our research experts:
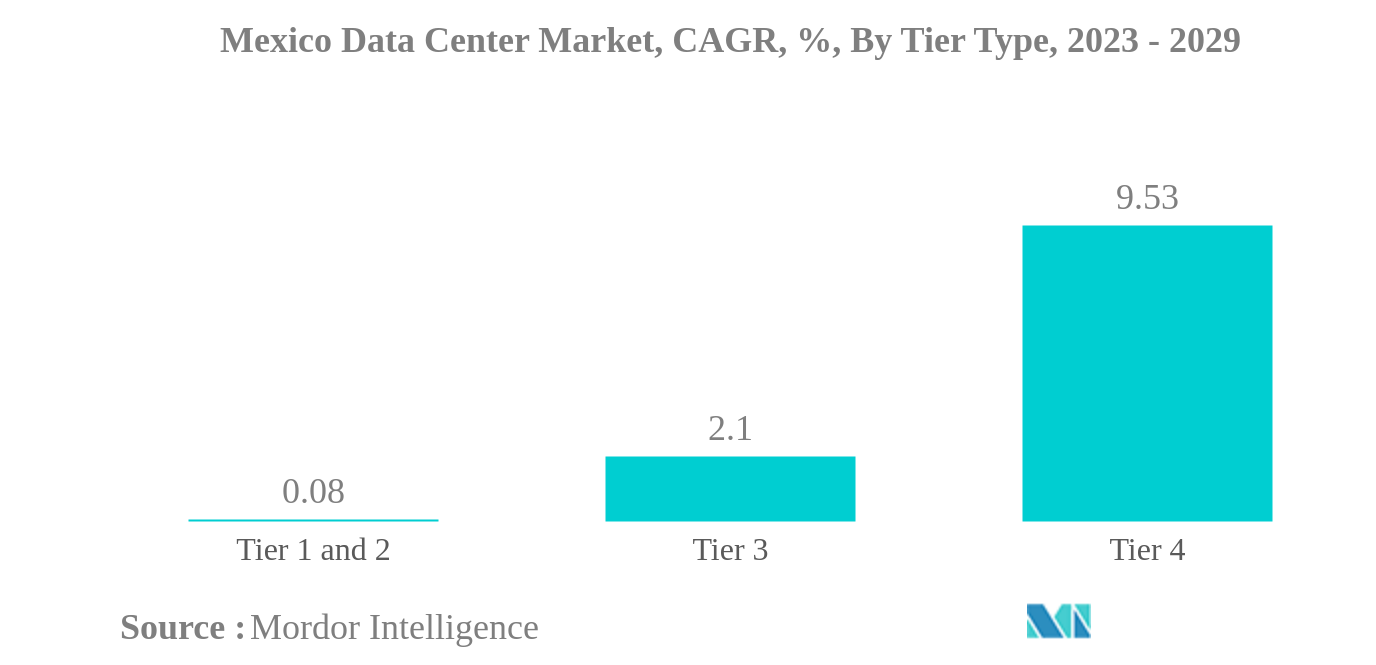
Tier 4 is the largest Tier Type
- The tier 4 data center segment is expected to reach an IT load capacity of 204.30 MW in 2023. It is further projected to exhibit a CAGR of 9.53%, surpassing an IT load capacity of 352.76 MW by 2029.
- While tier 1 and 2 facilities must be increasingly equipped to meet the growing demand for uninterrupted services from businesses, they are losing favor. Due to the increase of business continuity services available around the clock, tier 3 and 4 data centers have gained popularity. This is due to the increasing number of conglomerates. A tier 3 data center is equipped with several channels for electricity and cooling, as well as methods for updating and maintaining it without bringing it offline. It has an annual downtime of 1.6 hours and an expected uptime of 99.982%. Because of the significantly better redundancy protections provided, small and medium-sized businesses typically choose to employ at least a Tier III-rated system.
- A tier 4 data center includes redundancy for every component and is fault-resistant. Clients should not face more than 26.3 minutes of downtime a year, according to a level 4 facility. Government organizations and major corporations with mission-critical servers and high customer or business demands typically use a tier 4 facility. The growth of data centers in Mexico with the best infrastructure certifications is facilitated by the entry of significant international corporations and an increase in the country's enterprises. Throughout the forecast period, the market is anticipated to demonstrate potential growth, which may lead to hyperscale colocation adoption by significant end users in the cloud and telecom industries. The popularity of computer solutions in Mexico is a key encouraging element for the development of tier 4 facilities.
Mexico Data Center Industry Overview
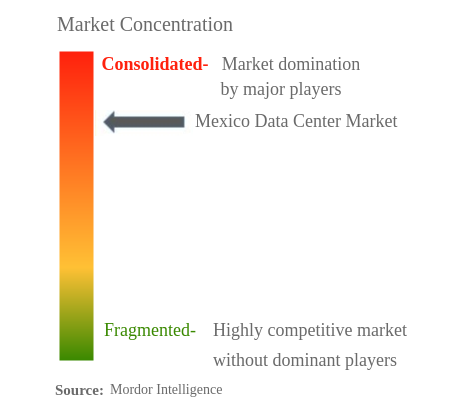
The Mexico Data Center Market is fairly consolidated, with the top five companies occupying 85.90%. The major players in this market are Ascenty (Digital Realty Trust, Inc.), Equinix, Inc., KIO Networks, NABIAX and Telmex (American Movil) (sorted alphabetically).
Mexico Data Center Market Leaders
Ascenty (Digital Realty Trust, Inc.)
Equinix, Inc.
KIO Networks
NABIAX
Telmex (American Movil)
*Disclaimer: Major Players sorted in no particular order
Mexico Data Center Market News
- November 2022: Kio Networks have purchased a new campus of data centers in the greater Mexico City Metro area. The campus, known as KIO MEX6, has a 50,000-square-meter building with a 20 MW energy capacity and the ability to house operations and essential communications and IT services.
- September 2022: The company, owned by América Móvil, signed a deal to jointly provide Oracle Cloud Infrastructure (OCI) services to clients throughout Mexico. As part of the collaboration, TELMEX-Triara was the host organization for the second Oracle Cloud Region planned for Mexico. Telmex's data center division, Triara, has five locations in Queretaro, Monterey, Mexico City, Guadalajara, and Cancun, offering 74,000 square meters (796,500 square feet) of space.
- August 2022: Ascenty has begun operating in Mexico with the announcement of the inauguration of its first two locations. The two new data centers in the city of Querétaro required BRL 1 billion in total investment for their installation. Mexico 1 has a 20,000 m2 area with a total power of 21 MW, while Mexico 2 has a 24,000 m2 area and a capacity of 31 MW. The buildings were put into use on July 1st, and as of now, Mexico 1 and Mexico 2 each have 20% and 25% of the total capacity of the data processing centers occupied by customers, respectively.
Mexico Data Center Market Report - Table of Contents
1. INTRODUCTION
1.1. Study Assumptions & Market Definition
1.2. Scope of the Study
1.3. Research Methodology
2. MARKET OUTLOOK
2.1. IT Load Capacity
2.2. Raised Floor Space
2.3. Colocation Revenue
2.4. Installed Racks
2.5. Rack Space Utilization
2.6. Submarine Cable
3. KEY INDUSTRY TRENDS
3.1. Smartphone Users
3.2. Data Traffic Per Smartphone
3.3. Mobile Data Speed
3.4. Broadband Data Speed
3.5. Fiber Connectivity Network
3.6. Regulatory Framework
3.7. Value Chain & Distribution Channel Analysis
4. MARKET SEGMENTATION
4.1. Hotspot
4.1.1. Guadalajara
4.1.2. Querétaro
4.1.3. Rest of Mexico
4.2. Data Center Size
4.2.1. Large
4.2.2. Massive
4.2.3. Medium
4.2.4. Mega
4.2.5. Small
4.3. Tier Type
4.3.1. Tier 1 and 2
4.3.2. Tier 3
4.3.3. Tier 4
4.4. Absorption
4.4.1. Non-Utilized
4.4.2. Utilized
4.4.2.1. By Colocation Type
4.4.2.1.1. Hyperscale
4.4.2.1.2. Retail
4.4.2.1.3. Wholesale
4.4.2.2. By End User
4.4.2.2.1. BFSI
4.4.2.2.2. Cloud
4.4.2.2.3. E-Commerce
4.4.2.2.4. Government
4.4.2.2.5. Manufacturing
4.4.2.2.6. Media & Entertainment
4.4.2.2.7. Telecom
4.4.2.2.8. Other End User
5. COMPETITIVE LANDSCAPE
5.1. Market Share Analysis
5.2. Company Landscape
5.3. Company Profiles
5.3.1. Ascenty (Digital Realty Trust, Inc.)
5.3.2. CloudHQ
5.3.3. EdgeUno, INC.
5.3.4. Equinix, Inc.
5.3.5. HostDime Global Corp.
5.3.6. KIO Networks
5.3.7. Lumen Technologies, Inc.
5.3.8. MetroCarrier (Megacable Holdings, S. A. B. de C. V)
5.3.9. NABIAX
5.3.10. ODATA (Patria Investments Ltd.)
5.3.11. Servidores y Sistemas S.A. de C.V
5.3.12. Telmex (American Movil)
5.4. LIST OF COMPANIES STUDIED
6. KEY STRATEGIC QUESTIONS FOR DATA CENTER CEOS
7. APPENDIX
7.1. Global Overview
7.1.1. Overview
7.1.2. Porter’s Five Forces Framework
7.1.3. Global Value Chain Analysis
7.1.4. Global Market Size and DROs
7.2. Sources & References
7.3. List of Tables & Figures
7.4. Primary Insights
7.5. Data Pack
7.6. Glossary of Terms
List of Tables & Figures
- Figure 1:
- MEXICO DATA CENTER MARKET, RAISED FLOOR SPACE, VOLUME IN SQ. FT.(000'), 2017 - 2029
- Figure 2:
- MEXICO DATA CENTER MARKET, COLOCATION REVENUE, VALUE IN USD MILLION, 2017 - 2029
- Figure 3:
- MEXICO DATA CENTER MARKET, RACK SPACE UTILIZATION, VALUE IN (%), 2017 - 2029
- Figure 4:
- MEXICO DATA CENTER MARKET, SMARTPHONE USERS, VOLUME IN MILLION, 2017 - 2029
- Figure 5:
- MEXICO DATA CENTER MARKET, DATA TRAFFIC PER SMARTPHONE, VOLUME IN GB, 2017 - 2029
- Figure 6:
- MEXICO DATA CENTER MARKET, MOBILE DATA SPEED, VOLUME IN MBPS, 2017 - 2029
- Figure 7:
- MEXICO DATA CENTER MARKET, BROADBAND SPEED, VOLUME IN MBPS, 2017 - 2029
- Figure 8:
- MEXICO DATA CENTER MARKET, FIBER CONNECTIVITY NETWORK, VOLUME IN KILOMETER, 2017 - 2029
- Figure 9:
- MEXICO DATA CENTER MARKET, VOLUME, MW, 2017 - 2029
- Figure 10:
- MEXICO DATA CENTER MARKET, BY HOTSPOT, VOLUME IN MW, 2017 - 2029
- Figure 11:
- MEXICO DATA CENTER MARKET, SHARE(%), BY HOTSPOT, 2017 - 2023 - 2029
- Figure 12:
- MEXICO DATA CENTER MARKET, GUADALAJARA, VOLUME IN MW, 2017 - 2029
- Figure 13:
- MEXICO DATA CENTER MARKET, BY DATA CENTER SIZE, GUADALAJARA, VOLUME SHARE (%), 2022 - 2029
- Figure 14:
- MEXICO DATA CENTER MARKET, QUERÉTARO, VOLUME IN MW, 2017 - 2029
- Figure 15:
- MEXICO DATA CENTER MARKET, BY DATA CENTER SIZE, QUERÉTARO, VOLUME SHARE (%), 2022 - 2029
- Figure 16:
- MEXICO DATA CENTER MARKET, REST OF MEXICO, VOLUME IN MW, 2017 - 2029
- Figure 17:
- MEXICO DATA CENTER MARKET, BY DATA CENTER SIZE, REST OF MEXICO, VOLUME SHARE (%), 2022 - 2029
- Figure 18:
- MEXICO DATA CENTER MARKET, BY DATA CENTER SIZE, VOLUME IN MW, 2017 - 2029
- Figure 19:
- MEXICO DATA CENTER MARKET, SHARE(%), BY DATA CENTER SIZE, 2017 - 2023 - 2029
- Figure 20:
- MEXICO DATA CENTER MARKET, LARGE, VOLUME IN MW, 2017 - 2029
- Figure 21:
- MEXICO DATA CENTER MARKET, MASSIVE, VOLUME IN MW, 2017 - 2029
- Figure 22:
- MEXICO DATA CENTER MARKET, MEDIUM, VOLUME IN MW, 2017 - 2029
- Figure 23:
- MEXICO DATA CENTER MARKET, MEGA, VOLUME IN MW, 2017 - 2029
- Figure 24:
- MEXICO DATA CENTER MARKET, SMALL, VOLUME IN MW, 2017 - 2029
- Figure 25:
- MEXICO DATA CENTER MARKET, BY TIER TYPE, VOLUME IN MW, 2017 - 2029
- Figure 26:
- MEXICO DATA CENTER MARKET, SHARE(%), BY TIER TYPE, 2017 - 2023 - 2029
- Figure 27:
- MEXICO DATA CENTER MARKET, TIER 1&2, VOLUME IN MW, 2017 - 2029
- Figure 28:
- MEXICO DATA CENTER MARKET, TIER 3, VOLUME IN MW, 2017 - 2029
- Figure 29:
- MEXICO DATA CENTER MARKET, TIER 4, VOLUME IN MW, 2017 - 2029
- Figure 30:
- MEXICO DATA CENTER MARKET, BY ABSORPTION, VOLUME IN MW, 2017 - 2029
- Figure 31:
- MEXICO DATA CENTER MARKET, SHARE(%), BY ABSORPTION, 2017 - 2023 - 2029
- Figure 32:
- MEXICO DATA CENTER MARKET, NON-UTILIZED, VOLUME IN MW, 2017 - 2029
- Figure 33:
- MEXICO DATA CENTER MARKET, BY COLOCATION TYPE, VOLUME IN MW, 2017 - 2029
- Figure 34:
- MEXICO DATA CENTER MARKET, SHARE(%), BY COLOCATION TYPE, 2017 - 2023 - 2029
- Figure 35:
- MEXICO DATA CENTER MARKET, HYPERSCALE, VOLUME IN MW, 2017 - 2029
- Figure 36:
- MEXICO DATA CENTER MARKET, RETAIL, VOLUME IN MW, 2017 - 2029
- Figure 37:
- MEXICO DATA CENTER MARKET, WHOLESALE, VOLUME IN MW, 2017 - 2029
- Figure 38:
- MEXICO DATA CENTER MARKET, BY END USER, VOLUME IN MW, 2017 - 2029
- Figure 39:
- MEXICO DATA CENTER MARKET, SHARE(%), BY END USER, 2017 - 2023 - 2029
- Figure 40:
- MEXICO DATA CENTER MARKET, BFSI, VOLUME IN MW, 2017 - 2029
- Figure 41:
- MEXICO DATA CENTER MARKET, CLOUD, VOLUME IN MW, 2017 - 2029
- Figure 42:
- MEXICO DATA CENTER MARKET, E-COMMERCE, VOLUME IN MW, 2017 - 2029
- Figure 43:
- MEXICO DATA CENTER MARKET, GOVERNMENT, VOLUME IN MW, 2017 - 2029
- Figure 44:
- MEXICO DATA CENTER MARKET, MANUFACTURING, VOLUME IN MW, 2017 - 2029
- Figure 45:
- MEXICO DATA CENTER MARKET, MEDIA & ENTERTAINMENT, VOLUME IN MW, 2017 - 2029
- Figure 46:
- MEXICO DATA CENTER MARKET, TELECOM, VOLUME IN MW, 2017 - 2029
- Figure 47:
- MEXICO DATA CENTER MARKET, OTHER END USER, VOLUME IN MW, 2017 - 2029
- Figure 48:
- MEXICO DATA CENTER MARKET, BY MAJOR PLAYER IT LOAD CAPACITY, 2022
Mexico Data Center Industry Segmentation
Guadalajara, Querétaro are covered as segments by Hotspot. Large, Massive, Medium, Mega, Small are covered as segments by Data Center Size. Tier 1 and 2, Tier 3, Tier 4 are covered as segments by Tier Type. Non-Utilized, Utilized are covered as segments by Absorption.| Hotspot | |
| Guadalajara | |
| Querétaro | |
| Rest of Mexico |
| Data Center Size | |
| Large | |
| Massive | |
| Medium | |
| Mega | |
| Small |
| Tier Type | |
| Tier 1 and 2 | |
| Tier 3 | |
| Tier 4 |
| Absorption | |||||||||||||||||
| Non-Utilized | |||||||||||||||||
|
Market Definition
- IT LOAD CAPACITY - The IT load capacity or installed capacity, refers to the amount of energy consumed by servers and network equipments placed in a rack installed. It is measured in megawatt (MW).
- ABSORPTION RATE - It denotes the extend to which the data center capacity has been leased out. For instance, a 100 MW DC has leased out 75 MW, then absorption rate would be 75%. It is also referred as utilization rate and leased-out capacity.
- RAISED FLOOR SPACE - It is an elevated space build over the floor. This gap between the original floor and the elevated floor is used to accommodate wiring, cooling, and other data center equipment. This arrangement assist in having proper wiring and cooling infrastructure. It is measured in square feet (ft^2).
- DATA CENTER SIZE - Data Center Size is segmented based on the raised floor space allocated to the data center facilities. Mega DC - # of Racks must be more than 9000 or RFS (raised floor space) must be more than 225001 Sq. ft; Massive DC - # of Racks must be in between 9000 and 3001 or RFS must be in between 225000 Sq. ft and 75001 Sq. ft; Large DC - # of Racks must be in between 3000 and 801 or RFS must be in between 75000 Sq. ft and 20001 Sq. ft; Medium DC # of Racks must be in between 800 and 201 or RFS must be in between 20000 Sq. ft and 5001 Sq. ft; Small DC - # of Racks must be less than 200 or RFS must be less than 5000 Sq. ft.
- TIER TYPE - According to Uptime Institute the data centers are classified into four tiers based on the proficiencies of redundant equipment of the data center infrastructure. In this segment the data center are segmented as Tier 1,Tier 2, Tier 3 and Tier 4.
- COLOCATION TYPE - The segment is segregated into 3 categories namely Retail, Wholesale and Hyperscale Colocation service. The categorization is done based on the amount of IT load leased out to potential customers. Retail colocation service has leased capacity less than 250 kW; Wholesale colocation services has leased capacity between 251 kW and 4 MW and Hyperscale colocation services has leased capacity more than 4 MW.
- END CONSUMERS - The Data Center Market operates on a B2B basis. BFSI, Government, Cloud Operators, Media and Entertainment, E-Commerce, Telecom and Manufacturing are the major end-consumers in the market studied. The scope only includes colocation service operators catering to the increasing digitalization of the end-user industries.
Research Methodology
Mordor Intelligence follows a four-step methodology in all our reports.
- Step-1: Identify Key Variables: In order to build a robust forecasting methodology, the variables and factors identified in Step-1 are tested against available historical market numbers. Through an iterative process, the variables required for market forecast are set and the model is built on the basis of these variables.
- Step-2: Build a Market Model: Market-size estimations for the forecast years are in nominal terms. Inflation is not a part of the pricing, and the average selling price (ASP) is kept constant throughout the forecast period for each country.
- Step-3: Validate and Finalize: In this important step, all market numbers, variables and analyst calls are validated through an extensive network of primary research experts from the market studied. The respondents are selected across levels and functions to generate a holistic picture of the market studied.
- Step-4: Research Outputs: Syndicated Reports, Custom Consulting Assignments, Databases & Subscription Platforms


