North America Feed Amino Acids Market Size

| Icons | Lable | Value |
|---|---|---|
|
|
Study Period | 2017 - 2029 |
|
|
Base Year For Estimation | 2022 |
|
|
CAGR | 5.63 % |
|
|
Largest Share by Sub Additive | Lysine |
|
|
Largest Share by Country | United States |
|
|
Market Concentration | High |
Major Players |
||
|
|
||
|
*Disclaimer: Major Players sorted in no particular order |
North America Feed Amino Acids Market Analysis
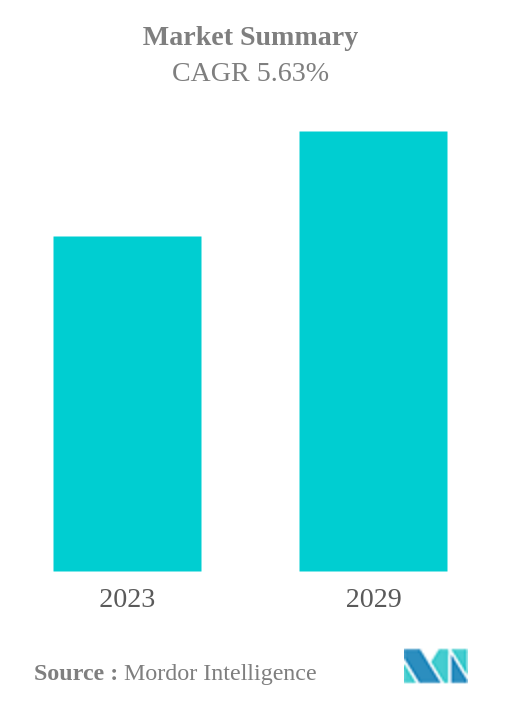
The North America Feed Amino Acids Market is projected to register a CAGR of 5.63%
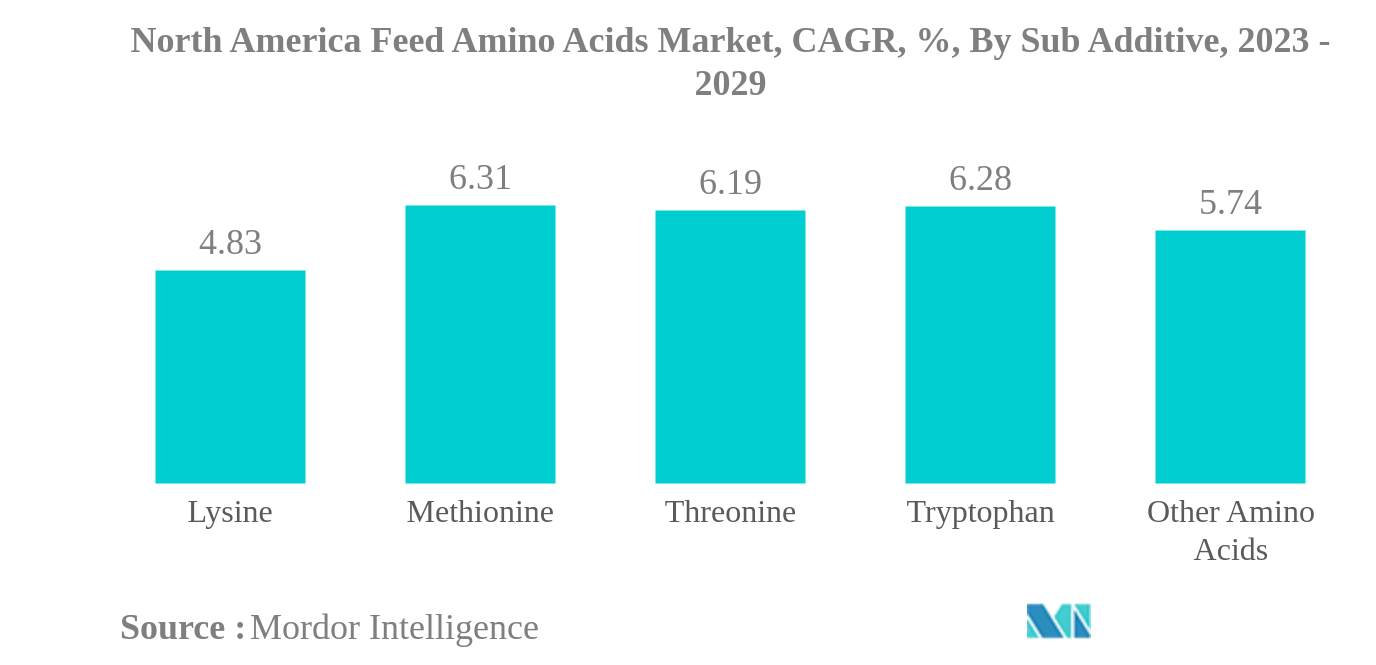
- Lysine is the Largest Sub Additive: Lysine demand is the highest in the region to reduce the feed cost by balancing the amino acid composition in livestock diets and increasing the demand for poultry and pig meat.
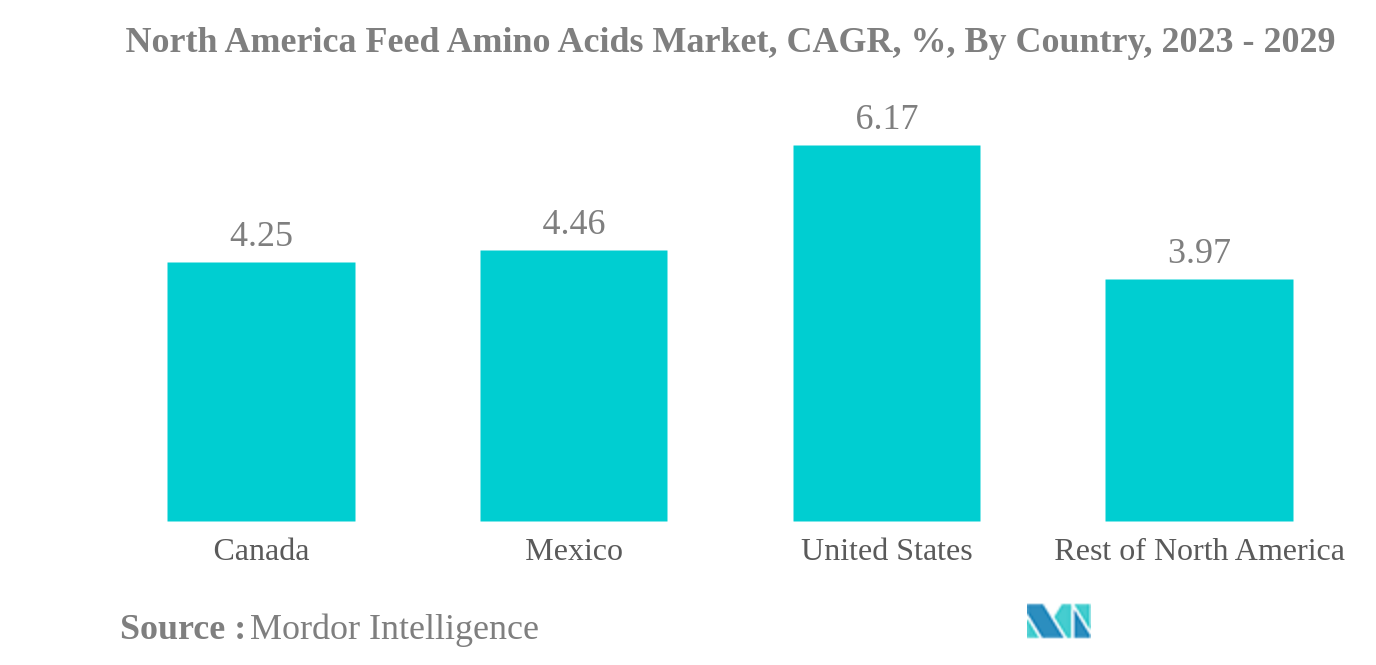
- United States is the Largest Country: The United States is the largest country because the increased poultry meat consumption in both households and the commercial food industry has promoted amino acid consumption.
- Methionine is the Fastest-growing Sub Additive: Owing to benefits such as optimum body weight, improved gut health, and easy digestion in animals, methionine is the fastest-growing segment in the region.
- United States is the Fastest-growing Country: The increase in the demand for meat and livestock products and feed production has helped the US market be the fastest-growing region.
North America Feed Amino Acids Market Trends
This section covers the major market trends shaping the North America Feed Amino Acids Market according to our research experts:
Lysine is the largest Sub Additive
- The feed amino acids market in the region saw a substantial increase in 2019, with a growth rate of 15.4% compared to the prior year. This growth is attributed to the rise in feed production, specifically for ruminants, with every type of amino acid used in feed experiencing an increase in value.
- In North America, lysine and methionine were the most commonly used feed amino acid sub-additives in 2022, owing to their essential role in animal gut health and digestion. Tryptophan and methionine are anticipated to exhibit the highest growth rates during the forecast period, with a projected CAGR of 6.3%. While tryptophan is costlier than other amino acids and therefore constitutes a smaller share of the market, it plays a crucial role in promoting growth and increasing feed intake during the pre-weaning stage of an animal's life cycle.
- The United States is the largest country in the feed amino acids market, with lysine and methionine accounting for nearly 70% of the market in 2022. The country's growth rate in this market is the highest in North America, partly due to the affordability and moderate dosage rate of lysine.
- Despite varying costs, all feed amino acid types are projected to grow at similar rates in the forecast period throughout the region, given their ability to provide various benefits for animals, including promoting gut health, muscle development, and egg formation. These benefits extend to a range of animal types and serve diverse purposes. The market is expected to grow due to these benefits, driving the demand for feed amino acids.
United States is the largest Country
- In 2022, the North American feed amino acids market accounted for 21% of the total feed additives market, with a value of USD 1.8 billion. This is due to the increasing demand for meat and meat products, leading to the rise in the usage of amino acids in the animal feed industry. The market value increased by 15.4% in 2019 compared to 2018, driven by the increase in feed production in the region, particularly in the United States.
- Poultry animals were the most significant users of feed amino acids in 2022, with a market value of USD 0.7 billion, representing 41.7% of theNorth American feed amino acid market. Ruminants followed with a market share of 35.1% in the same year. The consumption of poultry meat in households and the commercial food industry has increased the usage of amino acids, with broilers accounting for over 70% of the total feed amino acid usage in poultry animals.
- Lysine and methionine were the most commonly used amino acids in 2022, accounting for 43.2% and 29.8% of the total amino acid market in the region, respectively. These amino acids are essential for animal growth and development since animal tissues cannot synthesize them or cannot make the adequate amount needed.
- The United States is the largest feed amino acid market in North America, accounting for 70% of the total feed amino acid market in 2022. The country was also the fastest-growing in terms of the feed amino acids market, with a CAGR of 6.2% during the forecast period. The demand for meat and meat products, along with the increasing demand for feed that enhances growth, development, and resistance to diseases, is expected to drive the North American feed amino acids market at a CAGR of 5.6% during the forecast period.
North America Feed Amino Acids Industry Overview
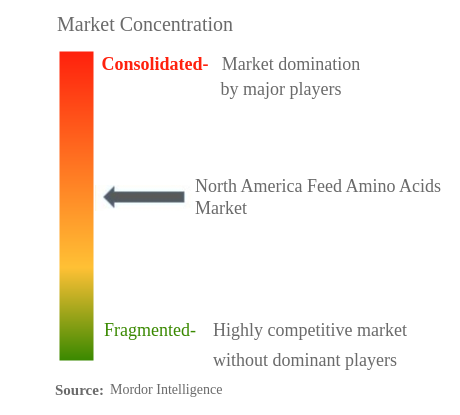
The North America Feed Amino Acids Market is moderately consolidated, with the top five companies occupying 55.19%. The major players in this market are Archer Daniel Midland Co., Evonik Industries AG, IFF(Danisco Animal Nutrition), Land O'Lakes and SHV (Nutreco NV) (sorted alphabetically).
North America Feed Amino Acids Market Leaders
Archer Daniel Midland Co.
Evonik Industries AG
IFF(Danisco Animal Nutrition)
Land O'Lakes
SHV (Nutreco NV)
*Disclaimer: Major Players sorted in no particular order
North America Feed Amino Acids Market News
- January 2023: Novus International acquired the Biotech company Agrivida to develop new feed additives.
- October 2022: The partnership between Evonik and BASF allowed Evonik certain non-exclusive licensing rights to OpteinicsTM, a digital solution to improve comprehension and reduce the environmental impact of the animal protein and feed industries.
- May 2022: Kemin Industries has opened new offices and a distribution center in Mexico to serve Kemin Animal Nutrition by providing the highest-quality services and customized solutions.
North America Feed Amino Acids Market Report - Table of Contents
1. INTRODUCTION
1.1. Study Assumptions & Market Definition
1.2. Scope of the Study
1.3. Research Methodology
2. KEY INDUSTRY TRENDS
2.1. Animal Headcount
2.2. Feed Production
2.3. Regulatory Framework
2.4. Value Chain & Distribution Channel Analysis
3. MARKET SEGMENTATION
3.1. Sub Additive
3.1.1. Lysine
3.1.2. Methionine
3.1.3. Threonine
3.1.4. Tryptophan
3.1.5. Other Amino Acids
3.2. Animal
3.2.1. Aquaculture
3.2.1.1. By Sub Animal
3.2.1.1.1. Fish
3.2.1.1.2. Shrimp
3.2.1.1.3. Other Aquaculture Species
3.2.2. Poultry
3.2.2.1. By Sub Animal
3.2.2.1.1. Broiler
3.2.2.1.2. Layer
3.2.2.1.3. Other Poultry Birds
3.2.3. Ruminants
3.2.3.1. By Sub Animal
3.2.3.1.1. Beef Cattle
3.2.3.1.2. Dairy Cattle
3.2.3.1.3. Other Ruminants
3.2.4. Swine
3.2.5. Other Animals
3.3. Country
3.3.1. Canada
3.3.2. Mexico
3.3.3. United States
3.3.4. Rest of North America
4. COMPETITIVE LANDSCAPE
4.1. Key Strategic Moves
4.2. Market Share Analysis
4.3. Company Landscape
4.4. Company Profiles
4.4.1. Adisseo
4.4.2. Ajinomoto Co., Inc.
4.4.3. Alltech, Inc.
4.4.4. Archer Daniel Midland Co.
4.4.5. Evonik Industries AG
4.4.6. IFF(Danisco Animal Nutrition)
4.4.7. Kemin Industries
4.4.8. Land O'Lakes
4.4.9. Novus International, Inc.
4.4.10. SHV (Nutreco NV)
5. KEY STRATEGIC QUESTIONS FOR FEED ADDITIVE CEOS
6. APPENDIX
6.1. Global Overview
6.1.1. Overview
6.1.2. Porter’s Five Forces Framework
6.1.3. Global Value Chain Analysis
6.1.4. Global Market Size and DROs
6.2. Sources & References
6.3. List of Tables & Figures
6.4. Primary Insights
6.5. Data Pack
6.6. Glossary of Terms
List of Tables & Figures
- Figure 1:
- NORTH AMERICA FEED AMINO ACIDS MARKET, ANIMAL HEAD COUNT, NUMBER, BY POULTRY, 2017-2022
- Figure 2:
- NORTH AMERICA FEED AMINO ACIDS MARKET, ANIMAL HEAD COUNT, NUMBER, BY RUMINANTS, 2017-2022
- Figure 3:
- NORTH AMERICA FEED AMINO ACIDS MARKET, ANIMAL HEAD COUNT, NUMBER, BY SWINE, 2017-2022
- Figure 4:
- NORTH AMERICA FEED AMINO ACIDS MARKET, FEED PRODUCTION, METRIC TON, BY AQUACULTURE, 2017-2022
- Figure 5:
- NORTH AMERICA FEED AMINO ACIDS MARKET, FEED PRODUCTION, METRIC TON, BY POULTRY, 2017-2022
- Figure 6:
- NORTH AMERICA FEED AMINO ACIDS MARKET, FEED PRODUCTION, METRIC TON, BY RUMINANTS, 2017-2022
- Figure 7:
- NORTH AMERICA FEED AMINO ACIDS MARKET, FEED PRODUCTION, METRIC TON, BY SWINE, 2017-2022
- Figure 8:
- NORTH AMERICA FEED AMINO ACIDS MARKET, VOLUME, METRIC TON, 2017 - 2029
- Figure 9:
- NORTH AMERICA FEED AMINO ACIDS MARKET, VALUE, USD, 2017 - 2029
- Figure 10:
- NORTH AMERICA FEED AMINO ACIDS MARKET, BY SUB ADDITIVE, VOLUME, METRIC TON, 2017 - 2029
- Figure 11:
- NORTH AMERICA FEED AMINO ACIDS MARKET, BY SUB ADDITIVE, VALUE, USD, 2017 - 2029
- Figure 12:
- NORTH AMERICA FEED AMINO ACIDS MARKET, VOLUME SHARE(%), BY SUB ADDITIVE, 2017 - 2029
- Figure 13:
- NORTH AMERICA FEED AMINO ACIDS MARKET, VALUE SHARE(%), BY SUB ADDITIVE, 2017 - 2029
- Figure 14:
- NORTH AMERICA FEED AMINO ACIDS MARKET, BY SUB ADDITIVE, VOLUME, METRIC TON, 2017 - 2029
- Figure 15:
- NORTH AMERICA FEED AMINO ACIDS MARKET, BY SUB ADDITIVE, VALUE, USD, 2017 - 2029
- Figure 16:
- NORTH AMERICA FEED AMINO ACIDS MARKET, VALUE SHARE(%), BY ANIMAL, 2022 - 2029
- Figure 17:
- NORTH AMERICA FEED AMINO ACIDS MARKET, BY SUB ADDITIVE, VOLUME, METRIC TON, 2017 - 2029
- Figure 18:
- NORTH AMERICA FEED AMINO ACIDS MARKET, BY SUB ADDITIVE, VALUE, USD, 2017 - 2029
- Figure 19:
- NORTH AMERICA FEED AMINO ACIDS MARKET, VALUE SHARE(%), BY ANIMAL, 2022 - 2029
- Figure 20:
- NORTH AMERICA FEED AMINO ACIDS MARKET, BY SUB ADDITIVE, VOLUME, METRIC TON, 2017 - 2029
- Figure 21:
- NORTH AMERICA FEED AMINO ACIDS MARKET, BY SUB ADDITIVE, VALUE, USD, 2017 - 2029
- Figure 22:
- NORTH AMERICA FEED AMINO ACIDS MARKET, VALUE SHARE(%), BY ANIMAL, 2022 - 2029
- Figure 23:
- NORTH AMERICA FEED AMINO ACIDS MARKET, BY SUB ADDITIVE, VOLUME, METRIC TON, 2017 - 2029
- Figure 24:
- NORTH AMERICA FEED AMINO ACIDS MARKET, BY SUB ADDITIVE, VALUE, USD, 2017 - 2029
- Figure 25:
- NORTH AMERICA FEED AMINO ACIDS MARKET, VALUE SHARE(%), BY ANIMAL, 2022 - 2029
- Figure 26:
- NORTH AMERICA FEED AMINO ACIDS MARKET, BY SUB ADDITIVE, VOLUME, METRIC TON, 2017 - 2029
- Figure 27:
- NORTH AMERICA FEED AMINO ACIDS MARKET, BY SUB ADDITIVE, VALUE, USD, 2017 - 2029
- Figure 28:
- NORTH AMERICA FEED AMINO ACIDS MARKET, VALUE SHARE(%), BY ANIMAL, 2022 - 2029
- Figure 29:
- NORTH AMERICA FEED AMINO ACIDS MARKET, BY ANIMAL, VOLUME, METRIC TON, 2017 - 2029
- Figure 30:
- NORTH AMERICA FEED AMINO ACIDS MARKET, BY ANIMAL, VALUE, USD, 2017 - 2029
- Figure 31:
- NORTH AMERICA FEED AMINO ACIDS MARKET, VOLUME SHARE(%), BY ANIMAL, 2017 - 2029
- Figure 32:
- NORTH AMERICA FEED AMINO ACIDS MARKET, VALUE SHARE(%), BY ANIMAL, 2017 - 2029
- Figure 33:
- NORTH AMERICA FEED AMINO ACIDS MARKET, BY SUB ANIMAL, VOLUME, METRIC TON, 2017 - 2029
- Figure 34:
- NORTH AMERICA FEED AMINO ACIDS MARKET, BY SUB ANIMAL, VALUE, USD, 2017 - 2029
- Figure 35:
- NORTH AMERICA FEED AMINO ACIDS MARKET, VOLUME SHARE(%), BY SUB ANIMAL, 2017 - 2029
- Figure 36:
- NORTH AMERICA FEED AMINO ACIDS MARKET, VALUE SHARE(%), BY SUB ANIMAL, 2017 - 2029
- Figure 37:
- NORTH AMERICA FEED AMINO ACIDS MARKET, BY SUB ANIMAL, VOLUME, METRIC TON, 2017 - 2029
- Figure 38:
- NORTH AMERICA FEED AMINO ACIDS MARKET, BY SUB ANIMAL, VALUE, USD, 2017 - 2029
- Figure 39:
- NORTH AMERICA FEED AMINO ACIDS MARKET, VALUE SHARE(%), BY SUB ADDITIVE, 2022 - 2029
- Figure 40:
- NORTH AMERICA FEED AMINO ACIDS MARKET, BY SUB ANIMAL, VOLUME, METRIC TON, 2017 - 2029
- Figure 41:
- NORTH AMERICA FEED AMINO ACIDS MARKET, BY SUB ANIMAL, VALUE, USD, 2017 - 2029
- Figure 42:
- NORTH AMERICA FEED AMINO ACIDS MARKET, VALUE SHARE(%), BY SUB ADDITIVE, 2022 - 2029
- Figure 43:
- NORTH AMERICA FEED AMINO ACIDS MARKET, BY SUB ANIMAL, VOLUME, METRIC TON, 2017 - 2029
- Figure 44:
- NORTH AMERICA FEED AMINO ACIDS MARKET, BY SUB ANIMAL, VALUE, USD, 2017 - 2029
- Figure 45:
- NORTH AMERICA FEED AMINO ACIDS MARKET, VALUE SHARE(%), BY SUB ADDITIVE, 2022 - 2029
- Figure 46:
- NORTH AMERICA FEED AMINO ACIDS MARKET, BY SUB ANIMAL, VOLUME, METRIC TON, 2017 - 2029
- Figure 47:
- NORTH AMERICA FEED AMINO ACIDS MARKET, BY SUB ANIMAL, VALUE, USD, 2017 - 2029
- Figure 48:
- NORTH AMERICA FEED AMINO ACIDS MARKET, VOLUME SHARE(%), BY SUB ANIMAL, 2017 - 2029
- Figure 49:
- NORTH AMERICA FEED AMINO ACIDS MARKET, VALUE SHARE(%), BY SUB ANIMAL, 2017 - 2029
- Figure 50:
- NORTH AMERICA FEED AMINO ACIDS MARKET, BY SUB ANIMAL, VOLUME, METRIC TON, 2017 - 2029
- Figure 51:
- NORTH AMERICA FEED AMINO ACIDS MARKET, BY SUB ANIMAL, VALUE, USD, 2017 - 2029
- Figure 52:
- NORTH AMERICA FEED AMINO ACIDS MARKET, VALUE SHARE(%), BY SUB ADDITIVE, 2022 - 2029
- Figure 53:
- NORTH AMERICA FEED AMINO ACIDS MARKET, BY SUB ANIMAL, VOLUME, METRIC TON, 2017 - 2029
- Figure 54:
- NORTH AMERICA FEED AMINO ACIDS MARKET, BY SUB ANIMAL, VALUE, USD, 2017 - 2029
- Figure 55:
- NORTH AMERICA FEED AMINO ACIDS MARKET, VALUE SHARE(%), BY SUB ADDITIVE, 2022 - 2029
- Figure 56:
- NORTH AMERICA FEED AMINO ACIDS MARKET, BY SUB ANIMAL, VOLUME, METRIC TON, 2017 - 2029
- Figure 57:
- NORTH AMERICA FEED AMINO ACIDS MARKET, BY SUB ANIMAL, VALUE, USD, 2017 - 2029
- Figure 58:
- NORTH AMERICA FEED AMINO ACIDS MARKET, VALUE SHARE(%), BY SUB ADDITIVE, 2022 - 2029
- Figure 59:
- NORTH AMERICA FEED AMINO ACIDS MARKET, BY SUB ANIMAL, VOLUME, METRIC TON, 2017 - 2029
- Figure 60:
- NORTH AMERICA FEED AMINO ACIDS MARKET, BY SUB ANIMAL, VALUE, USD, 2017 - 2029
- Figure 61:
- NORTH AMERICA FEED AMINO ACIDS MARKET, VOLUME SHARE(%), BY SUB ANIMAL, 2017 - 2029
- Figure 62:
- NORTH AMERICA FEED AMINO ACIDS MARKET, VALUE SHARE(%), BY SUB ANIMAL, 2017 - 2029
- Figure 63:
- NORTH AMERICA FEED AMINO ACIDS MARKET, BY SUB ANIMAL, VOLUME, METRIC TON, 2017 - 2029
- Figure 64:
- NORTH AMERICA FEED AMINO ACIDS MARKET, BY SUB ANIMAL, VALUE, USD, 2017 - 2029
- Figure 65:
- NORTH AMERICA FEED AMINO ACIDS MARKET, VALUE SHARE(%), BY SUB ADDITIVE, 2022 - 2029
- Figure 66:
- NORTH AMERICA FEED AMINO ACIDS MARKET, BY SUB ANIMAL, VOLUME, METRIC TON, 2017 - 2029
- Figure 67:
- NORTH AMERICA FEED AMINO ACIDS MARKET, BY SUB ANIMAL, VALUE, USD, 2017 - 2029
- Figure 68:
- NORTH AMERICA FEED AMINO ACIDS MARKET, VALUE SHARE(%), BY SUB ADDITIVE, 2022 - 2029
- Figure 69:
- NORTH AMERICA FEED AMINO ACIDS MARKET, BY SUB ANIMAL, VOLUME, METRIC TON, 2017 - 2029
- Figure 70:
- NORTH AMERICA FEED AMINO ACIDS MARKET, BY SUB ANIMAL, VALUE, USD, 2017 - 2029
- Figure 71:
- NORTH AMERICA FEED AMINO ACIDS MARKET, VALUE SHARE(%), BY SUB ADDITIVE, 2022 - 2029
- Figure 72:
- NORTH AMERICA FEED AMINO ACIDS MARKET, BY ANIMAL, VOLUME, METRIC TON, 2017 - 2029
- Figure 73:
- NORTH AMERICA FEED AMINO ACIDS MARKET, BY ANIMAL, VALUE, USD, 2017 - 2029
- Figure 74:
- NORTH AMERICA FEED AMINO ACIDS MARKET, VALUE SHARE(%), BY SUB ADDITIVE, 2022 - 2029
- Figure 75:
- NORTH AMERICA FEED AMINO ACIDS MARKET, BY ANIMAL, VOLUME, METRIC TON, 2017 - 2029
- Figure 76:
- NORTH AMERICA FEED AMINO ACIDS MARKET, BY ANIMAL, VALUE, USD, 2017 - 2029
- Figure 77:
- NORTH AMERICA FEED AMINO ACIDS MARKET, VALUE SHARE(%), BY SUB ADDITIVE, 2022 - 2029
- Figure 78:
- NORTH AMERICA FEED AMINO ACIDS MARKET, BY COUNTRY, VOLUME, METRIC TON, 2017 - 2029
- Figure 79:
- NORTH AMERICA FEED AMINO ACIDS MARKET, BY COUNTRY, VALUE, USD, 2017 - 2029
- Figure 80:
- NORTH AMERICA FEED AMINO ACIDS MARKET, VOLUME SHARE(%), BY COUNTRY, 2017 - 2029
- Figure 81:
- NORTH AMERICA FEED AMINO ACIDS MARKET, VALUE SHARE(%), BY COUNTRY, 2017 - 2029
- Figure 82:
- NORTH AMERICA FEED AMINO ACIDS MARKET, BY COUNTRY, VOLUME, METRIC TON, 2017 - 2029
- Figure 83:
- NORTH AMERICA FEED AMINO ACIDS MARKET, BY COUNTRY, VALUE, USD, 2017 - 2029
- Figure 84:
- NORTH AMERICA FEED AMINO ACIDS MARKET, VALUE SHARE(%), BY SUB ADDITIVE, 2022 - 2029
- Figure 85:
- NORTH AMERICA FEED AMINO ACIDS MARKET, BY COUNTRY, VOLUME, METRIC TON, 2017 - 2029
- Figure 86:
- NORTH AMERICA FEED AMINO ACIDS MARKET, BY COUNTRY, VALUE, USD, 2017 - 2029
- Figure 87:
- NORTH AMERICA FEED AMINO ACIDS MARKET, VALUE SHARE(%), BY SUB ADDITIVE, 2022 - 2029
- Figure 88:
- NORTH AMERICA FEED AMINO ACIDS MARKET, BY COUNTRY, VOLUME, METRIC TON, 2017 - 2029
- Figure 89:
- NORTH AMERICA FEED AMINO ACIDS MARKET, BY COUNTRY, VALUE, USD, 2017 - 2029
- Figure 90:
- NORTH AMERICA FEED AMINO ACIDS MARKET, VALUE SHARE(%), BY SUB ADDITIVE, 2022 - 2029
- Figure 91:
- NORTH AMERICA FEED AMINO ACIDS MARKET, BY COUNTRY, VOLUME, METRIC TON, 2017 - 2029
- Figure 92:
- NORTH AMERICA FEED AMINO ACIDS MARKET, BY COUNTRY, VALUE, USD, 2017 - 2029
- Figure 93:
- NORTH AMERICA FEED AMINO ACIDS MARKET, VALUE SHARE(%), BY SUB ADDITIVE, 2022 - 2029
- Figure 94:
- NORTH AMERICA FEED AMINO ACIDS MARKET, MOST ACTIVE COMPANIES, BY NUMBER OF STRATEGIC MOVES, 2016 - 2022
- Figure 95:
- NORTH AMERICA FEED AMINO ACIDS MARKET, MOST ADOPTED STRATEGIES, 2016 - 2022
- Figure 96:
- NORTH AMERICA FEED AMINO ACIDS MARKET SHARE(%), BY MAJOR PLAYERS, 2022
North America Feed Amino Acids Industry Segmentation
Lysine, Methionine, Threonine, Tryptophan are covered as segments by Sub Additive. Aquaculture, Poultry, Ruminants, Swine are covered as segments by Animal. Canada, Mexico, United States are covered as segments by Country.| Sub Additive | |
| Lysine | |
| Methionine | |
| Threonine | |
| Tryptophan | |
| Other Amino Acids |
| Animal | |||||||
| |||||||
| |||||||
| |||||||
| Swine | |||||||
| Other Animals |
| Country | |
| Canada | |
| Mexico | |
| United States | |
| Rest of North America |
Market Definition
- FUNCTIONS - For the purpose of the study, feed additives are considered to be commercially-manufactured products that are used to enhance the characteristics such as weight gain, feed conversion ratio, and feed intake when fed in appropriate proportions.
- RESELLERS - Companies engaged in reselling of feed additives without value addition have been excluded from the market scope, in order to avoid double counting.
- END CONSUMERS - Compound feed manufacturers are considered to be end-consumers in the market studied. The scope excludes farmers buying feed additives to be used directly as supplements or premixes.
- INTERNAL COMPANY CONSUMPTION - Companies engaged in the production of compound feed as well as the manufacturing of feed additives are part of the study. However, while estimating the market sizes, the internal consumption of feed additives by such companies has been excluded.
Research Methodology
Mordor Intelligence follows a four-step methodology in all our reports.
- Step-1: Identify Key Variables: The quantifiable key variables (industry and extraneous) pertaining to the specific product segment and country are selected from a group of relevant variables & factors based on desk research & literature review; along with primary expert inputs. These variables are further confirmed through regression modeling (wherever required).
- Step-2: Build a Market Model: In order to build a robust forecasting methodology, the variables and factors identified in Step-1 are tested against available historical market numbers. Through an iterative process, the variables required for market forecast are set and the model is built on the basis of these variables.
- Step-3: Validate and Finalize: In this important step, all market numbers, variables and analyst calls are validated through an extensive network of primary research experts from the market studied. The respondents are selected across levels and functions to generate a holistic picture of the market studied.
- Step-4: Research Outputs: Syndicated Reports, Custom Consulting Assignments, Databases & Subscription Platforms


