US Full Truckload Road Freight Transport Market Size

| Icons | Lable | Value |
|---|---|---|
|
|
Study Period | 2016 - 2028 |
|
|
Base Year For Estimation | 2021 |
|
|
CAGR | 3.86 % |
|
|
Largest Share by End User | Wholesale and Retail Trade |
|
|
Fastest Growing by End User | Agriculture, Fishing and Forestry |
|
|
Market Concentration | High |
Major Players |
||
|
|
||
|
*Disclaimer: Major Players sorted in no particular order |
US Full Truckload Road Freight Transport Market Analysis
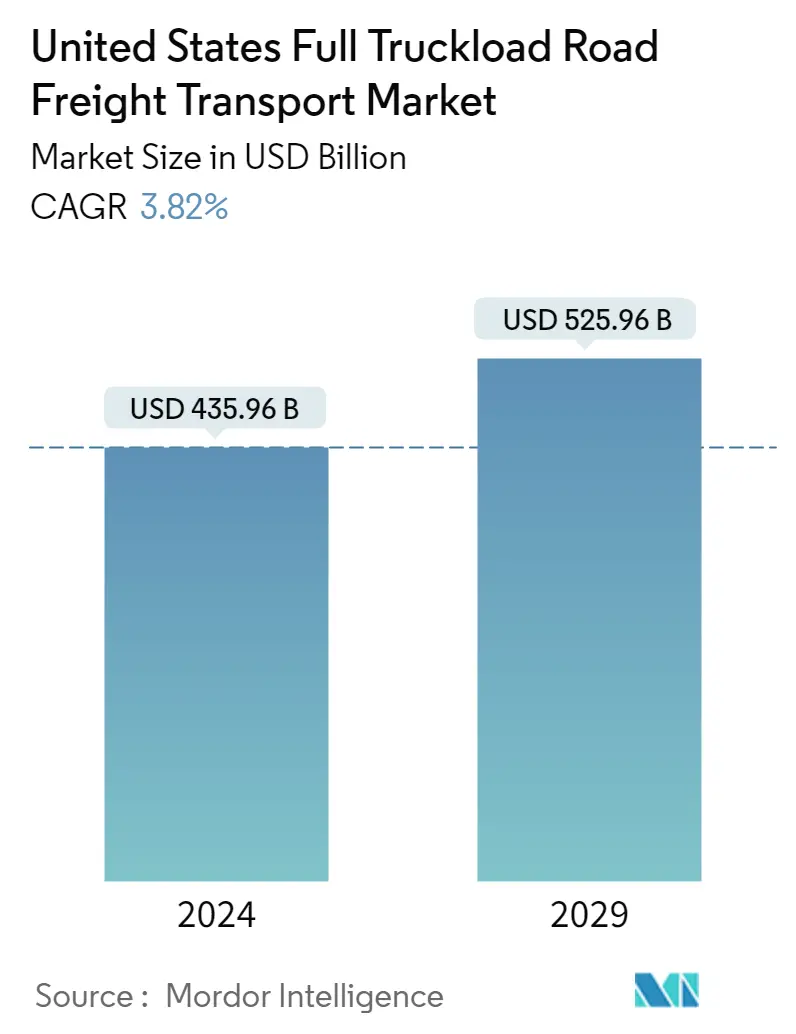
The United States Full Truckload Road Freight Transport Market is projected to register a CAGR of 3.86%
- Largest Segment by Destination - Domestic : The domestic segment dominated the international trucking segment in the United States in the full truckload market as all freight tonnage moved throughout the United States has been gaining a faster momentum over the past few years.
- Largest Segment by End User - Wholesale and Retail Trade : The wholesale and retail trade segment has been experiencing growth due to an increase in B2B e-commerce sales during the COVID-19 pandemic.
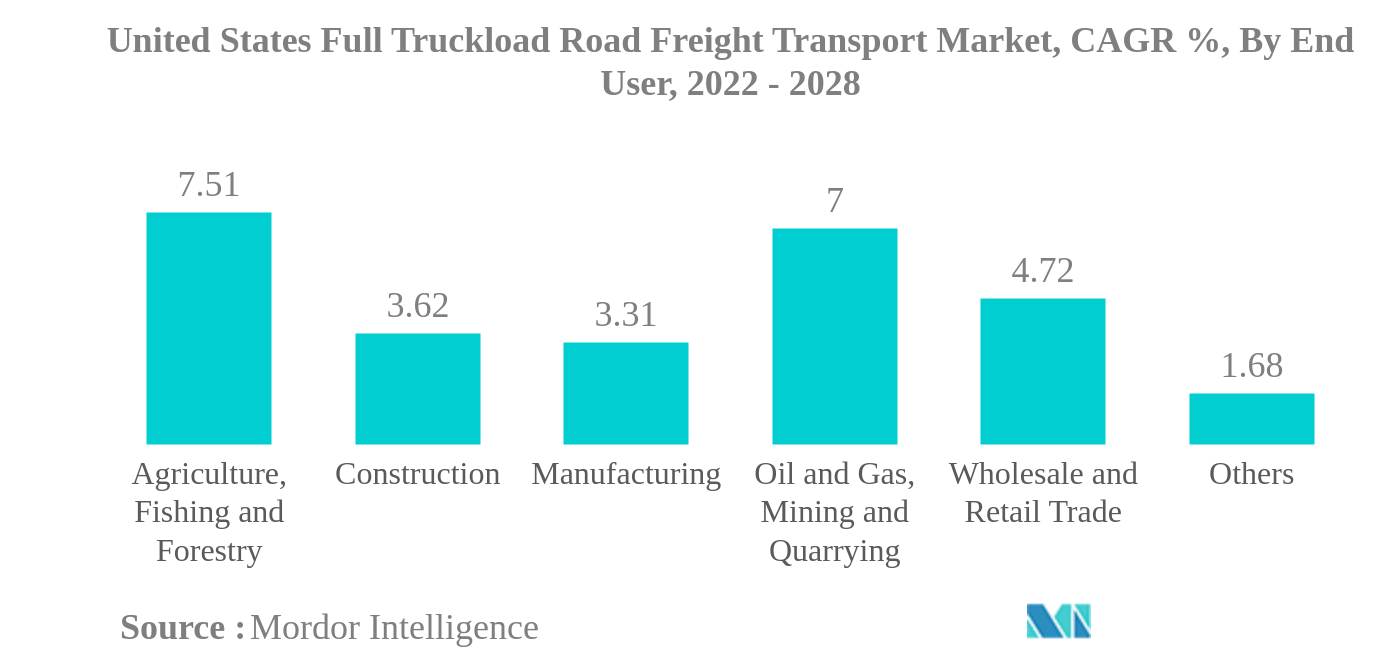
- Fastest Growing Segment by End User - Agriculture, Fishing and Forestry : The agriculture, fishing and forestry segment has been experiencing the fastest growth in the United States owing to the increased production in response to rising domestic and international demand. For instance, it grew by 5.31% YoY in 2021.
- Fastest Growing Segment by Destination - Domestic : Due to driver shortages, limits on cross-border transportation during the pandemic, and increasingly stringent border controls, the domestic segment maintained a faster-growing percentage share throughout the historical period.
US Full Truckload Road Freight Transport Market Trends
This section covers the major market trends shaping the US Full Truckload Road Freight Transport Market according to our research experts:
Wholesale and Retail Trade is the largest segment by End User.
- The end-user segment of the full truckload market experienced a decline of 1.63% YoY in 2019 due to the United States-China trade war and additional tariff increases on imports. The oil and gas, mining, and quarrying sector experienced a significant decline (-12.85% YoY in value) due to the slowing global economy, which was an impact of the trade war between the two countries.
- However, in 2021, the end-user segment of the full truckload market experienced a recovery of around 7.90% YoY, as the economy of the United States recovered from COVID-19 and the impact of the trade war. During the historical period (2016-2021), the full truckload market registered a CAGR of 4.31% in value, with the wholesale and retail trade segment having the maximum share, closely followed by the manufacturing sector.
- During the forecast period (2022-2028), the agriculture, fishing, and forestry segment is expected to register the highest CAGR of 7.58% followed by the oil and gas, mining, and quarrying sector with a CAGR of 7.12%. The agriculture, fishing, and forestry segment is expected to witness significant growth as agricultural production in the United States is anticipated to grow over the next decade. The oil and gas, mining, and quarrying segment of the full truckload market is expected to grow immensely as the oil and gas value chain in North America is expected to be driven by new project launches in the United States, which may account for 70% of overall projects.
US Full Truckload Road Freight Transport Industry Overview
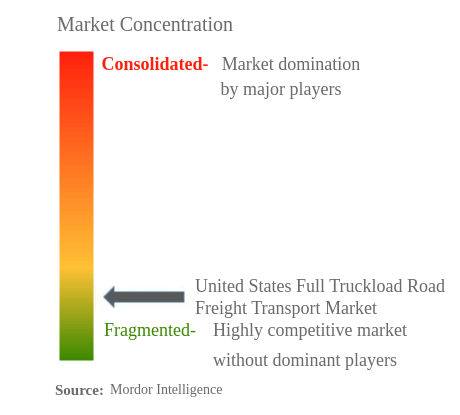
The United States Full Truckload Road Freight Transport Market is fragmented, with the top five companies occupying 16.54%. The major players in this market are C.H. Robinson, J.B.Hunt Transport Services Inc., Landstar System Inc., Ryder System and United Parcel Service (UPS) (sorted alphabetically).
US Full Truckload Road Freight Transport Market Leaders
C.H. Robinson
J.B.Hunt Transport Services Inc.
Landstar System Inc.
Ryder System
United Parcel Service (UPS)
*Disclaimer: Major Players sorted in no particular order
US Full Truckload Road Freight Transport Market News
- May 2022: Landstar System provides Landstar Clarity™, a new freight-tracking exception-management tool. With this tool, location data from trucks can be updated every 15 minutes and it also has many more features for problem-solving along the supply chain.
- April 2022: J.B. Hunt Transport Services Inc. announced the launch of CLEAN Transport™, a new program that will allow customers to acquire carbon offset credits equivalent to the emissions created by their shipments
- March 2022: Yellow Corporation opened 17ᵗʰ professional truck driving academy in Carlisle, PA with the U.S. Department of Labor.
US Full Truckload Road Freight Transport Market Report - Table of Contents
1. EXECUTIVE SUMMARY & KEY FINDINGS
2. REPORT OFFERS
3. INTRODUCTION
3.1. Study Assumptions & Market Definition
3.2. Scope of the Study
3.3. Research Methodology
4. KEY INDUSTRY TRENDS
4.1. GDP Distribution By Economic Activity
4.2. GDP Growth By Economic Activity
4.3. Wholesale Price Inflation
4.4. Economic Performance And Profile
4.5. Transport And Storage Sector GDP
4.6. Logistics Performance
4.7. Modal Share Of Freight Transport Sector
4.8. Length Of Roads
4.9. Export Trends
4.10. Import Trends
4.11. Fuel Pricing Trends
4.12. Trucking Operational Costs
4.13. Trucking Fleet Size By Type
4.14. Major Truck Suppliers
4.15. Road Freight Tonnage Trends
4.16. Road Freight Pricing Trends
4.17. Regulatory Framework
4.18. Value Chain & Distribution Channel Analysis
5. MARKET SEGMENTATION
5.1. End User
5.1.1. Agriculture, Fishing And Forestry
5.1.2. Construction
5.1.3. Manufacturing
5.1.4. Oil And Gas, Mining And Quarrying
5.1.5. Wholesale And Retail Trade
5.1.6. Others
5.2. Destination
5.2.1. Domestic
5.2.2. International
6. COMPETITIVE LANDSCAPE
6.1. Key Strategic Moves
6.2. Market Share Analysis
6.3. Company Landscape
6.4. Company Profiles
6.4.1. ArcBest
6.4.2. C.H. Robinson
6.4.3. Deutsche Post DHL Group
6.4.4. J.B.Hunt Transport Services Inc.
6.4.5. Knight-Swift Transportation
6.4.6. Landstar System Inc.
6.4.7. Ryder System
6.4.8. United Parcel Service (UPS)
6.4.9. Werner Enterprises Inc.
6.4.10. Yellow Corporation
7. KEY STRATEGIC QUESTIONS FOR ROAD FREIGHT CEOS
8. APPENDIX
8.1. Global Logistics Market Overview
8.1.1. Overview
8.1.2. Porter’s Five Forces Framework
8.1.3. Global Value Chain Analysis
8.1.4. Market Dynamics (Market Drivers, Restraints & Opportunities)
8.2. Sources & References
8.3. List of Tables & Figures
8.4. Primary Insights
8.5. Data Pack
8.6. Glossary of Terms
8.7. Currency Exchange Rate
List of Tables & Figures
- Figure 1:
- DISTRIBUTION OF GROSS DOMESTIC PRODUCT BY ECONOMIC ACTIVITY, UNITED STATES, SHARE %, 2021
- Figure 2:
- GROWTH OF GROSS DOMESTIC PRODUCT BY ECONOMIC ACTIVITY, UNITED STATES, CAGR %, 2016 – 2021
- Figure 3:
- WHOLESALE PRICE INFLATION RATE, UNITED STATES, PERCENTAGE (%), 2016 – 2021
- Figure 4:
- TRENDS IN E-COMMERCE INDUSTRY, UNITED STATES, VALUE, USD, 2016 – 2021
- Figure 5:
- TRENDS IN E-COMMERCE INDUSTRY BY SECTOR, UNITED STATES, SHARE %, 2021
- Figure 6:
- TRENDS IN MANUFACTURING INDUSTRY, UNITED STATES, VALUE, USD, 2016 – 2021
- Figure 7:
- TRENDS IN MANUFACTURING INDUSTRY BY SECTOR, UNITED STATES, SHARE %, 2021
- Figure 8:
- TRANSPORT AND STORAGE SECTOR GROSS DOMESTIC PRODUCT, UNITED STATES, VALUE, USD, 2016 – 2021
- Figure 9:
- TRANSPORT AND STORAGE SECTOR GROSS DOMESTIC PRODUCT, UNITED STATES, SHARE %, 2016 – 2021
- Figure 10:
- LOGISTICS PERFORMANCE, UNITED STATES, RANK, 2010 – 2018
- Figure 11:
- MODAL SHARE OF FREIGHT TRANSPORT SECTOR, UNITED STATES, SHARE %, BY VOLUME (TONS), SHARE%, 2021
- Figure 12:
- LENGTH OF ROADS BY TYPE OF SURFACE, UNITED STATES, SHARE %, 2021
- Figure 13:
- LENGTH OF ROADS BY TYPE OF ROAD, UNITED STATES, SHARE %, 2021
- Figure 14:
- VALUE OF EXPORTS, UNITED STATES, USD, 2016-2021
- Figure 15:
- VALUE OF IMPORTS, UNITED STATES, USD, 2016-2021
- Figure 16:
- FUEL PRICE BY TYPE OF FUEL, UNITED STATES, USD PER LITRE, 2016-2021
- Figure 17:
- TRUCKING OPERATIONAL COSTS, UNITED STATES, SHARE %, 2021
- Figure 18:
- TRUCKING FLEET SIZE BY TYPE, UNITED STATES, SHARE %, 2021
- Figure 19:
- MAJOR TRUCK SUPPLIER BRANDS, UNITED STATES, SHARE %, 2021
- Figure 20:
- ROAD FREIGHT TRANSPORT LOAD PICKED, UNITED STATES, TONS, 2016-2028
- Figure 21:
- ROAD FREIGHT TRANSPORT RATES, UNITED STATES, USD/TON-KM, 2016-2021
- Figure 22:
- UNITED STATES FULL TRUCKLOAD ROAD FREIGHT TRANSPORT MARKET, VOLUME, TON-KM, 2016 - 2028
- Figure 23:
- UNITED STATES FULL TRUCKLOAD ROAD FREIGHT TRANSPORT MARKET, VALUE, USD, 2016 - 2028
- Figure 24:
- UNITED STATES FULL TRUCKLOAD ROAD FREIGHT TRANSPORT MARKET, BY END USER, VOLUME, TON-KM, 2016 - 2028
- Figure 25:
- UNITED STATES FULL TRUCKLOAD ROAD FREIGHT TRANSPORT MARKET, BY END USER, VALUE, USD, 2016 - 2028
- Figure 26:
- UNITED STATES FULL TRUCKLOAD ROAD FREIGHT TRANSPORT MARKET, SHARE(%), VALUE, BY END USER, 2016 - 2028
- Figure 27:
- UNITED STATES FULL TRUCKLOAD ROAD FREIGHT TRANSPORT MARKET, AGRICULTURE, FISHING AND FORESTRY, VOLUME, TON-KM, 2016 - 2028
- Figure 28:
- UNITED STATES FULL TRUCKLOAD ROAD FREIGHT TRANSPORT MARKET, AGRICULTURE, FISHING AND FORESTRY, VALUE, USD, 2016 - 2028
- Figure 29:
- UNITED STATES FULL TRUCKLOAD ROAD FREIGHT TRANSPORT MARKET, CONSTRUCTION, VOLUME, TON-KM, 2016 - 2028
- Figure 30:
- UNITED STATES FULL TRUCKLOAD ROAD FREIGHT TRANSPORT MARKET, CONSTRUCTION, VALUE, USD, 2016 - 2028
- Figure 31:
- UNITED STATES FULL TRUCKLOAD ROAD FREIGHT TRANSPORT MARKET, MANUFACTURING, VOLUME, TON-KM, 2016 - 2028
- Figure 32:
- UNITED STATES FULL TRUCKLOAD ROAD FREIGHT TRANSPORT MARKET, MANUFACTURING, VALUE, USD, 2016 - 2028
- Figure 33:
- UNITED STATES FULL TRUCKLOAD ROAD FREIGHT TRANSPORT MARKET, OIL AND GAS, MINING AND QUARRYING, VOLUME, TON-KM, 2016 - 2028
- Figure 34:
- UNITED STATES FULL TRUCKLOAD ROAD FREIGHT TRANSPORT MARKET, OIL AND GAS, MINING AND QUARRYING, VALUE, USD, 2016 - 2028
- Figure 35:
- UNITED STATES FULL TRUCKLOAD ROAD FREIGHT TRANSPORT MARKET, WHOLESALE AND RETAIL TRADE, VOLUME, TON-KM, 2016 - 2028
- Figure 36:
- UNITED STATES FULL TRUCKLOAD ROAD FREIGHT TRANSPORT MARKET, WHOLESALE AND RETAIL TRADE, VALUE, USD, 2016 - 2028
- Figure 37:
- UNITED STATES FULL TRUCKLOAD ROAD FREIGHT TRANSPORT MARKET, OTHERS, VOLUME, TON-KM, 2016 - 2028
- Figure 38:
- UNITED STATES FULL TRUCKLOAD ROAD FREIGHT TRANSPORT MARKET, OTHERS, VALUE, USD, 2016 - 2028
- Figure 39:
- UNITED STATES FULL TRUCKLOAD ROAD FREIGHT TRANSPORT MARKET, BY DESTINATION, VOLUME, TON-KM, 2016 - 2028
- Figure 40:
- UNITED STATES FULL TRUCKLOAD ROAD FREIGHT TRANSPORT MARKET, BY DESTINATION, VALUE, USD, 2016 - 2028
- Figure 41:
- UNITED STATES FULL TRUCKLOAD ROAD FREIGHT TRANSPORT MARKET, SHARE(%), VALUE, BY DESTINATION, 2016 - 2028
- Figure 42:
- UNITED STATES FULL TRUCKLOAD ROAD FREIGHT TRANSPORT MARKET, DOMESTIC, VOLUME, TON-KM, 2016 - 2028
- Figure 43:
- UNITED STATES FULL TRUCKLOAD ROAD FREIGHT TRANSPORT MARKET, DOMESTIC, VALUE, USD, 2016 - 2028
- Figure 44:
- UNITED STATES FULL TRUCKLOAD ROAD FREIGHT TRANSPORT MARKET, INTERNATIONAL, VOLUME, TON-KM, 2016 - 2028
- Figure 45:
- UNITED STATES FULL TRUCKLOAD ROAD FREIGHT TRANSPORT MARKET, INTERNATIONAL, VALUE, USD, 2016 - 2028
- Figure 46:
- UNITED STATES FULL TRUCKLOAD ROAD FREIGHT TRANSPORT MARKET, MOST ACTIVE COMPANIES, BY NUMBER OF STRATEGIC MOVES, 2018 - 2021
- Figure 47:
- UNITED STATES FULL TRUCKLOAD ROAD FREIGHT TRANSPORT MARKET, MOST ADOPTED STRATEGIES, 2018 - 2021
- Figure 48:
- UNITED STATES FULL TRUCKLOAD ROAD FREIGHT TRANSPORT MARKET SHARE(%), BY MAJOR PLAYERS, 2021
US Full Truckload Road Freight Transport Industry Segmentation
Agriculture, Fishing And Forestry, Construction, Manufacturing, Oil And Gas, Mining And Quarrying, Wholesale And Retail Trade, Others are covered as segments by End User. Domestic, International are covered as segments by Destination.| End User | |
| Agriculture, Fishing And Forestry | |
| Construction | |
| Manufacturing | |
| Oil And Gas, Mining And Quarrying | |
| Wholesale And Retail Trade | |
| Others |
| Destination | |
| Domestic | |
| International |
Market Definition
- Vehicle Types - Passenger Vehicles, Commercial Vehicles and Motorcycles are the vehicle types considered under the automotive lubricants market.
- Product Types - For the purpose of this study, lubricant products such as engine oils, transmission oils, greases and hydraulic fluids are taken into consideration.
- Service Refill - Service refill is the primary factor considered while accounting the lubricant consumption for each of the vehicle segments, under the study.
- Factory Fill - First lubricant fill-ups for newly produced vehicles are considered.
Research Methodology
Mordor Intelligence follows a four-step methodology in all our reports.
- Step-1: Identify Key Variables: In order to build a robust forecasting methodology, the variables and factors identified in Step-1 are tested against available historical market numbers. Through an iterative process, the variables required for market forecast are set and the model is built on the basis of these variables.
- Step-2: Build a Market Model: Market-size estimations for the forecast years are in nominal terms. Inflation is not a part of the pricing, and the average selling price (ASP) is kept constant throughout the forecast period for each country.
- Step-3: Validate and Finalize: In this important step, all market numbers, variables and analyst calls are validated through an extensive network of primary research experts from the market studied. The respondents are selected across levels and functions to generate a holistic picture of the market studied.
- Step-4: Research Outputs: Syndicated Reports, Custom Consulting Assignments, Databases & Subscription Platforms


