United States Red Meat Market Size

| Icons | Lable | Value |
|---|---|---|
|
|
Study Period | 2016 - 2028 |
|
|
Base Year For Estimation | 2021 |
|
|
CAGR | 0.79 % |
|
|
Largest Share by Type | Beef |
|
|
Fastest Growing by Type | Beef |
|
|
Market Concentration | High |
Major Players |
||
|
|
||
|
*Disclaimer: Major Players sorted in no particular order |
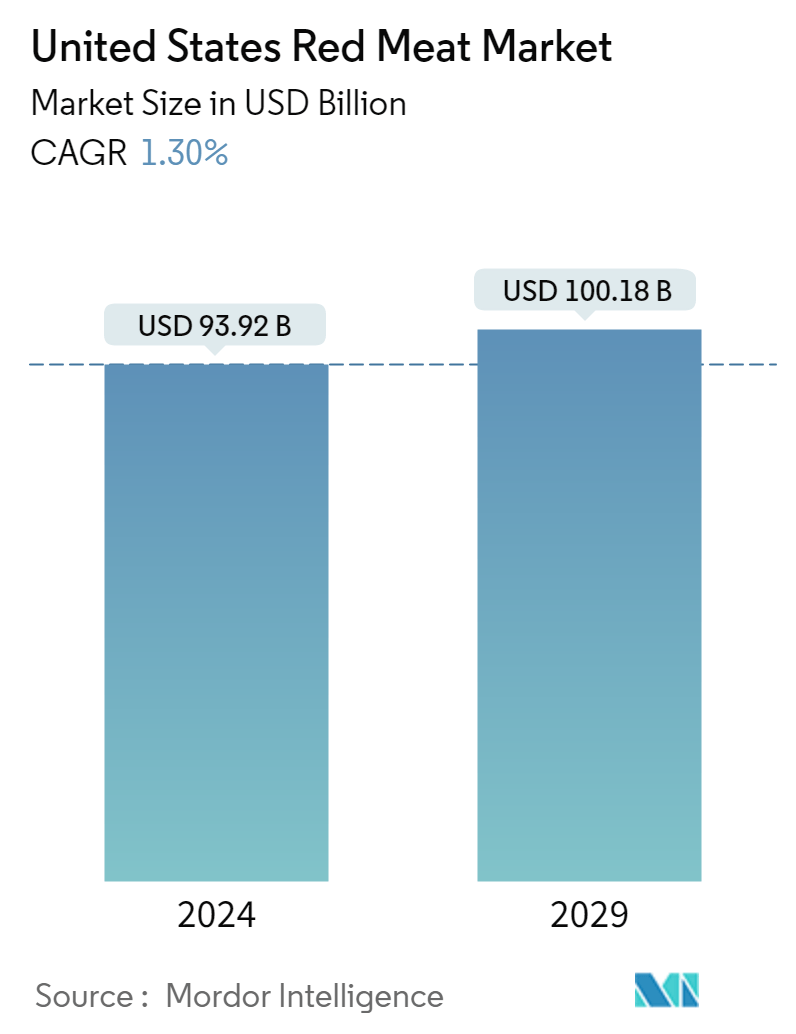
United States Red Meat Market Analysis
The United States Red Meat Market is projected to register a CAGR of 0.79%
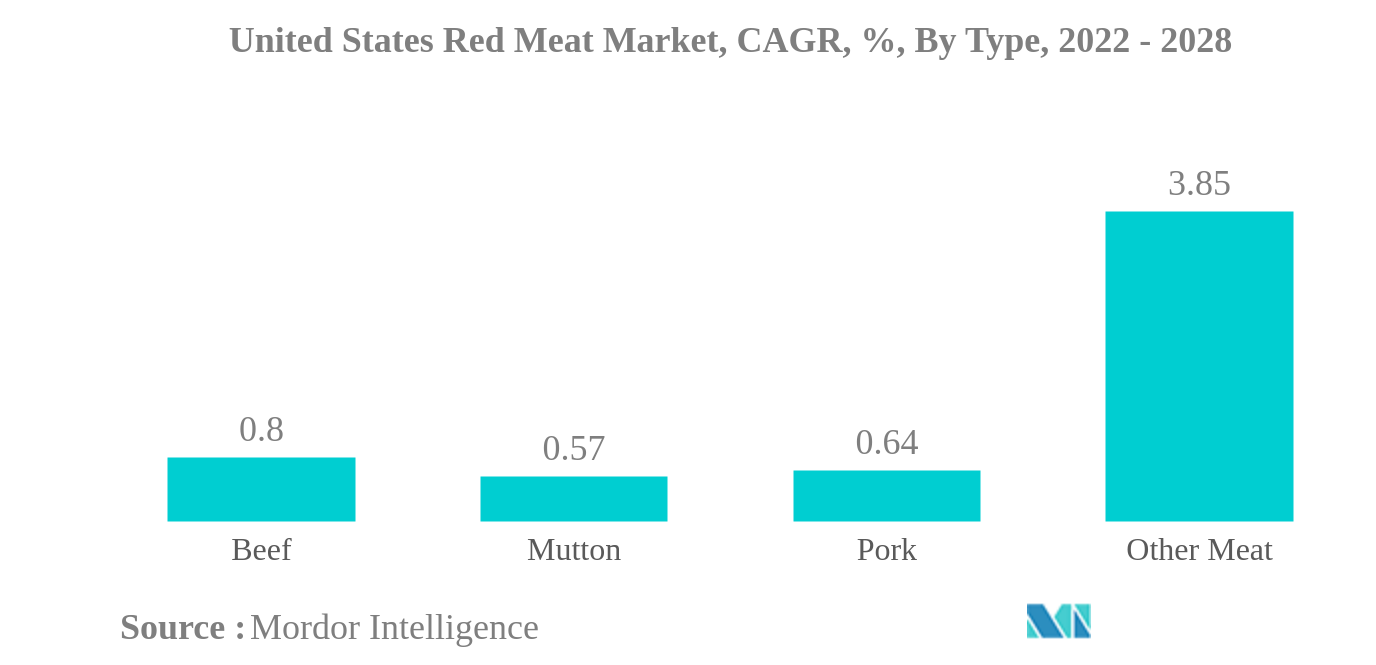
- Beef is the Largest Type : American citizens spend a lot of money on beef products, primarily due to the country's higher beef production, which is a considerable part of agriculture in the US.
- Fresh / Chilled is the Largest Form : Demand for fresh meat has risen in recent years, fueled by the lift of the ban on fresh beef import from Brazil by the Food Safety and Inspection Service of the USDA.
- Beef is the Fastest-growing Type : The most popular processed beef products consumed in the United States include ground beef, luncheon meat, sausages, hot dogs, salami, pepperoni, burgers, and beef jerky.
- Processed is the Fastest-growing Form : Processed pork dominates the segment as a result of the increasing demand for value-added pork products, including luncheon meat sausages, hot dogs, ham, and bacon.
United States Red Meat Market Trends
This section covers the major market trends shaping the United States Red Meat Market according to our research experts:
Beef is the largest Type
- By type, beef is the country's most consumed red meat and accounted for 26.45 kilograms per capita consumption in 2021, a 4.50% increase since 2016. In 2021, beef also observed the highest growth rate by value, registering 10.34%, in the market from 2020.
- Among California, Florida, New Jersey, New York, and Texas, Texans spent the most on beef products, amounting to a 26-28% share in 2018-2019. This was driven by higher beef production in the state. The cattle industry offers more than USD 13 billion annually to the Texan economy. Hamburger consumption in Nevada is higher than in most other states, with 267 per capita consumption.
- In 2021, a change in consumption patterns of US shoppers was witnessed, with 28% of shoppers focusing on choosing nutritious and healthy meat. This trend has been evident throughout the COVID-19 pandemic, with sales of grass-fed beef rising much faster and registering a 45% increase, in value, compared to 2020.
- Pork is the second-largest type of red market in the country primarily due to the increased consumption of processed pork, such as luncheon meat, sausage, ham, and bacon. Thus, processed pork is projected to record the fastest CAGR, amounting to 1.91%, during the forecast period. The dominance of processed pork indicates that processors play an important role in this sector, and many fresh pork packers are likely to be involved in manufacturing processed pork.
- Over the years, the value share of beef in the market has grown significantly while the same for pork has declined, although volume shares of the two were similar during the study period. This can be primarily attributed to the rising price of beef in the country, which grew at a CAGR of 6.11% from 2016-2022. During the same period, the price of pork grew at a lower CAGR of 1.83%.
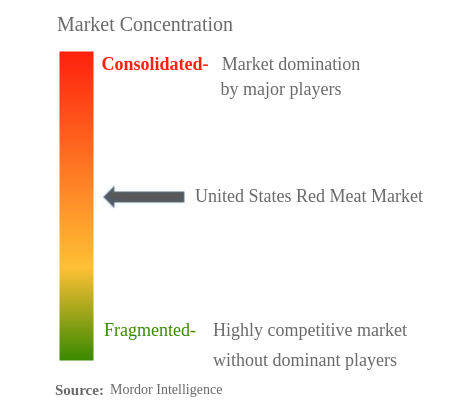
United States Red Meat Industry Overview
The United States Red Meat Market is moderately consolidated, with the top five companies occupying 46.83%. The major players in this market are Cargill, Incorporated, Hormel Foods Corporation, Marfrig Global Foods SA, Sysco Corporation and Tyson Foods, Inc. (sorted alphabetically).
United States Red Meat Market Leaders
Cargill, Incorporated
Hormel Foods Corporation
Marfrig Global Foods SA
Sysco Corporation
Tyson Foods, Inc.
*Disclaimer: Major Players sorted in no particular order
United States Red Meat Market News
- August 2022: Tyson Foods has announced the expansion of its Caseyville Prepared Foods Facility. The USD180 million investment project will help meet the growing demand for Tyson Foods’ iconic Hillshire Farm® and Jimmy Dean® branded products. The first line is expected to begin production this fall with the expansion set to be completed in the summer of 2023. The Caseyville plant currently produces Hillshire Farm® and Jimmy Dean® products and the 170,000 square foot expansion will specifically allow a larger production of grab-n-go snacking and breakfast items.
- June 2022: Hormel foods launched newest product i.e HORMEL® NATURAL CHOICE® Sandwich Pepperoni. The product is free from preservatives, nitrites or nitrates.
- May 2022: JBS SA acquired two manufacturing plants in the Middle East to increase its footprint in the production and sale of prepared foods in the region. The two plants are located in Saudi Arabia and the United Arab Emirates, with their own distribution networks in the Middle East.
United States Red Meat Market Report - Table of Contents
EXECUTIVE SUMMARY & KEY FINDINGS
1. INTRODUCTION
1.1. Study Assumptions & Market Definition
1.2. Scope of the Study
1.3. Research Methodology
2. KEY INDUSTRY TRENDS
2.1. Price Trends
2.2. Production Trends
2.3. Regulatory Framework
2.4. Value Chain & Distribution Channel Analysis
3. MARKET SEGMENTATION
3.1. Type
3.1.1. Beef
3.1.2. Mutton
3.1.3. Pork
3.1.4. Other Meat
3.2. Form
3.2.1. Fresh / Chilled
3.2.2. Frozen / Canned
3.2.3. Processed
3.3. Distribution Channel
3.3.1. Off-Trade
3.3.1.1. Convenience Stores
3.3.1.2. Online Channel
3.3.1.3. Supermarkets And Hypermarkets
3.3.1.4. Others
3.3.2. On-Trade
4. COMPETITIVE LANDSCAPE
4.1. Key Strategic Moves
4.2. Market Share Analysis
4.3. Company Landscape
4.4. Company Profiles
4.4.1. Cargill, Incorporated
4.4.2. Conagra Brands Incorporated
4.4.3. Hormel Foods Corporation
4.4.4. JBS SA
4.4.5. Marfrig Global Foods SA
4.4.6. NH Foods Ltd.
4.4.7. OSI Group
4.4.8. Sysco Corporation
4.4.9. The Clemens Family Corporation
4.4.10. The Kraft Heinz Company
4.4.11. Tyson Foods, Inc.
4.4.12. Vion Group
5. KEY STRATEGIC QUESTIONS FOR MEAT INDUSTRY CEOS
6. APPENDIX
6.1. Global Overview
6.1.1. Overview
6.1.2. Porter’s Five Forces Framework
6.1.3. Global Value Chain Analysis
6.1.4. Market Dynamics (DROs)
6.2. Sources & References
6.3. List of Tables & Figures
6.4. Primary Insights
6.5. Data Pack
6.6. Glossary of Terms
List of Tables & Figures
- Figure 1:
- UNITED STATES RED MEAT MARKET, BEEF, PRICE IN USD/METRIC TONNES, 2016 - 2022
- Figure 2:
- UNITED STATES RED MEAT MARKET, MUTTON, PRICE IN USD/METRIC TONNES, 2016 - 2022
- Figure 3:
- UNITED STATES RED MEAT MARKET, PORK, PRICE IN USD/METRIC TONNES, 2016 - 2022
- Figure 4:
- UNITED STATES RED MEAT MARKET, BEEF, PRODUCTION IN METRIC TONNES, 2016 - 2028
- Figure 5:
- UNITED STATES RED MEAT MARKET, MUTTON, PRODUCTION IN METRIC TONNES, 2016 - 2028
- Figure 6:
- UNITED STATES RED MEAT MARKET, PORK, PRODUCTION IN METRIC TONNES, 2016 - 2028
- Figure 7:
- UNITED STATES RED MEAT MARKET, VOLUME, METRIC TONNES, 2016 - 2028
- Figure 8:
- UNITED STATES RED MEAT MARKET, VALUE, USD, 2016 - 2028
- Figure 9:
- UNITED STATES RED MEAT MARKET, VOLUME IN METRIC TONNES, BY TYPE, 2016 - 2028
- Figure 10:
- UNITED STATES RED MEAT MARKET, VALUE IN USD, BY TYPE, 2016 - 2028
- Figure 11:
- UNITED STATES RED MEAT MARKET, VOLUME SHARE (%), BY TYPE, 2016 VS 2022 VS 2028
- Figure 12:
- UNITED STATES RED MEAT MARKET, VALUE SHARE (%), BY TYPE, 2016 VS 2022 VS 2028
- Figure 13:
- UNITED STATES RED MEAT MARKET, VOLUME IN METRIC TONNES, BEEF, 2016 - 2028
- Figure 14:
- UNITED STATES RED MEAT MARKET, VALUE IN USD, BEEF, 2016 - 2028
- Figure 15:
- UNITED STATES RED MEAT MARKET, BEEF, VALUE SHARE (%), BY FORM, 2021 VS 2028
- Figure 16:
- UNITED STATES RED MEAT MARKET, VOLUME IN METRIC TONNES, MUTTON, 2016 - 2028
- Figure 17:
- UNITED STATES RED MEAT MARKET, VALUE IN USD, MUTTON, 2016 - 2028
- Figure 18:
- UNITED STATES RED MEAT MARKET, MUTTON, VALUE SHARE (%), BY FORM, 2021 VS 2028
- Figure 19:
- UNITED STATES RED MEAT MARKET, VOLUME IN METRIC TONNES, PORK, 2016 - 2028
- Figure 20:
- UNITED STATES RED MEAT MARKET, VALUE IN USD, PORK, 2016 - 2028
- Figure 21:
- UNITED STATES RED MEAT MARKET, PORK, VALUE SHARE (%), BY FORM, 2021 VS 2028
- Figure 22:
- UNITED STATES RED MEAT MARKET, VOLUME IN METRIC TONNES, OTHER MEAT, 2016 - 2028
- Figure 23:
- UNITED STATES RED MEAT MARKET, VALUE IN USD, OTHER MEAT, 2016 - 2028
- Figure 24:
- UNITED STATES RED MEAT MARKET, OTHER MEAT, VALUE SHARE (%), BY FORM, 2021 VS 2028
- Figure 25:
- UNITED STATES RED MEAT MARKET, VOLUME IN METRIC TONNES, BY FORM, 2016 - 2028
- Figure 26:
- UNITED STATES RED MEAT MARKET, VALUE IN USD, BY FORM, 2016 - 2028
- Figure 27:
- UNITED STATES RED MEAT MARKET, VOLUME SHARE (%), BY FORM, 2016 VS 2022 VS 2028
- Figure 28:
- UNITED STATES RED MEAT MARKET, VALUE SHARE (%), BY FORM, 2016 VS 2022 VS 2028
- Figure 29:
- UNITED STATES RED MEAT MARKET, VOLUME IN METRIC TONNES, FRESH / CHILLED, 2016 - 2028
- Figure 30:
- UNITED STATES RED MEAT MARKET, VALUE IN USD, FRESH / CHILLED, 2016 - 2028
- Figure 31:
- UNITED STATES RED MEAT MARKET, FRESH / CHILLED, VALUE SHARE (%), BY TYPE, 2021 VS 2028
- Figure 32:
- UNITED STATES RED MEAT MARKET, VOLUME IN METRIC TONNES, FROZEN / CANNED, 2016 - 2028
- Figure 33:
- UNITED STATES RED MEAT MARKET, VALUE IN USD, FROZEN / CANNED, 2016 - 2028
- Figure 34:
- UNITED STATES RED MEAT MARKET, FROZEN / CANNED, VALUE SHARE (%), BY TYPE, 2021 VS 2028
- Figure 35:
- UNITED STATES RED MEAT MARKET, VOLUME IN METRIC TONNES, PROCESSED, 2016 - 2028
- Figure 36:
- UNITED STATES RED MEAT MARKET, VALUE IN USD, PROCESSED, 2016 - 2028
- Figure 37:
- UNITED STATES RED MEAT MARKET, PROCESSED, VALUE SHARE (%), BY TYPE, 2021 VS 2028
- Figure 38:
- UNITED STATES RED MEAT MARKET, VOLUME IN METRIC TONNES, BY DISTRIBUTION CHANNEL, 2016 - 2028
- Figure 39:
- UNITED STATES RED MEAT MARKET, VALUE IN USD, BY DISTRIBUTION CHANNEL, 2016 - 2028
- Figure 40:
- UNITED STATES RED MEAT MARKET, VOLUME SHARE (%), BY DISTRIBUTION CHANNEL, 2016 VS 2022 VS 2028
- Figure 41:
- UNITED STATES RED MEAT MARKET, VALUE SHARE (%), BY DISTRIBUTION CHANNEL, 2016 VS 2022 VS 2028
- Figure 42:
- UNITED STATES RED MEAT MARKET, VOLUME IN METRIC TONNES, BY OFF-TRADE, 2016 - 2028
- Figure 43:
- UNITED STATES RED MEAT MARKET, VALUE IN USD, BY OFF-TRADE, 2016 - 2028
- Figure 44:
- UNITED STATES RED MEAT MARKET, VOLUME SHARE (%), BY OFF-TRADE, 2016 VS 2022 VS 2028
- Figure 45:
- UNITED STATES RED MEAT MARKET, VALUE SHARE (%), BY OFF-TRADE, 2016 VS 2022 VS 2028
- Figure 46:
- UNITED STATES RED MEAT MARKET, VOLUME IN METRIC TONNES, CONVENIENCE STORES, 2016 - 2028
- Figure 47:
- UNITED STATES RED MEAT MARKET, VALUE IN USD, CONVENIENCE STORES, 2016 - 2028
- Figure 48:
- UNITED STATES RED MEAT MARKET, CONVENIENCE STORES, VALUE SHARE (%), BY TYPE, 2021 VS 2028
- Figure 49:
- UNITED STATES RED MEAT MARKET, VOLUME IN METRIC TONNES, ONLINE CHANNEL, 2016 - 2028
- Figure 50:
- UNITED STATES RED MEAT MARKET, VALUE IN USD, ONLINE CHANNEL, 2016 - 2028
- Figure 51:
- UNITED STATES RED MEAT MARKET, ONLINE CHANNEL, VALUE SHARE (%), BY TYPE, 2021 VS 2028
- Figure 52:
- UNITED STATES RED MEAT MARKET, VOLUME IN METRIC TONNES, SUPERMARKETS AND HYPERMARKETS, 2016 - 2028
- Figure 53:
- UNITED STATES RED MEAT MARKET, VALUE IN USD, SUPERMARKETS AND HYPERMARKETS, 2016 - 2028
- Figure 54:
- UNITED STATES RED MEAT MARKET, SUPERMARKETS AND HYPERMARKETS, VALUE SHARE (%), BY TYPE, 2021 VS 2028
- Figure 55:
- UNITED STATES RED MEAT MARKET, VOLUME IN METRIC TONNES, OTHERS, 2016 - 2028
- Figure 56:
- UNITED STATES RED MEAT MARKET, VALUE IN USD, OTHERS, 2016 - 2028
- Figure 57:
- UNITED STATES RED MEAT MARKET, OTHERS, VALUE SHARE (%), BY TYPE, 2021 VS 2028
- Figure 58:
- UNITED STATES RED MEAT MARKET, VOLUME IN METRIC TONNES, ON-TRADE, 2016 - 2028
- Figure 59:
- UNITED STATES RED MEAT MARKET, VALUE IN USD, ON-TRADE, 2016 - 2028
- Figure 60:
- UNITED STATES RED MEAT MARKET, MOST ACTIVE COMPANIES, BY NUMBER OF STRATEGIC MOVES, 2017 - 2022
- Figure 61:
- UNITED STATES RED MEAT MARKET, TOTAL NUMBER OF STRATEGIC MOVES, 2017 - 2022
- Figure 62:
- UNITED STATES RED MEAT MARKET SHARE(%), BY KEY PLAYERS, 2021
United States Red Meat Industry Segmentation
Beef, Mutton, Pork are covered as segments by Type. Fresh / Chilled, Frozen / Canned, Processed are covered as segments by Form. Off-Trade, On-Trade are covered as segments by Distribution Channel.| Type | |
| Beef | |
| Mutton | |
| Pork | |
| Other Meat |
| Form | |
| Fresh / Chilled | |
| Frozen / Canned | |
| Processed |
| Distribution Channel | ||||||
| ||||||
| On-Trade |
Market Definition
- Meat - Meat is defined as the flesh or other edible parts of an animal used for food. The end use of the meat industry consists of only human consumption. Meat is generally purchased from retail outlets for home cooking and consumption. For the market studied, only uncooked meat has been considered. This could be processed in various forms, which have been covered under the “Processed” form. The other purchases of meat happen through the consumption of meat at foodservice outlets (restaurants, hotels, catering, etc.).
- Other Meats - The other meat segment includes the meat of camel, horse, rabbit, etc. These are not so commonly consumed meat types but still, have a presence in distinct parts of the world. Regardless of it being part of red meat, we have considered these meat types separately for a better understanding of the market.
- Poultry Meat - Poultry meat also called white meat, comes from birds raised commercially or domestically for human consumption. This includes chicken, turkey, ducks, and geese.
- Red Meat - Red meat typically has a red color when raw and a dark color when cooked. It includes any meat that comes from mammals, such as beef, lamb, pork, goat, veal, and mutton.
Research Methodology
Mordor Intelligence follows a four-step methodology in all our reports.
- Step-1: Identify Key Variables: In order to build a robust forecasting methodology, the variables and factors identified in Step 1 are tested against available historical market numbers. Through an iterative process, the variables required for market forecast are set, and the model is built on the basis of these variables.
- Step-2: Build a Market Model: Market-size estimations for the forecast years are in nominal terms. Inflation is not a part of the pricing, and the average selling price (ASP) is kept constant throughout the forecast period for each country.
- Step-3: Validate and Finalize: In this important step, all market numbers, variables, and analyst calls are validated through an extensive network of primary research experts from the market studied. The respondents are selected across levels and functions to generate a holistic picture of the market studied.
- Step-4: Research Outputs: Syndicated Reports, Custom Consulting Assignments, Databases & Subscription Platforms


