US Bio Fertilizers Market Size

| Icons | Lable | Value |
|---|---|---|
|
|
Study Period | 2017 - 2029 |
|
|
Base Year For Estimation | 2022 |
|
|
CAGR | 12.81 % |
|
|
Largest Share by Form | Rhizobium |
|
|
Fastest Growing by Form | Rhizobium |
|
|
Market Concentration | High |
Major Players |
||
|
|
||
|
*Disclaimer: Major Players sorted in no particular order |
US Bio Fertilizers Market Analysis
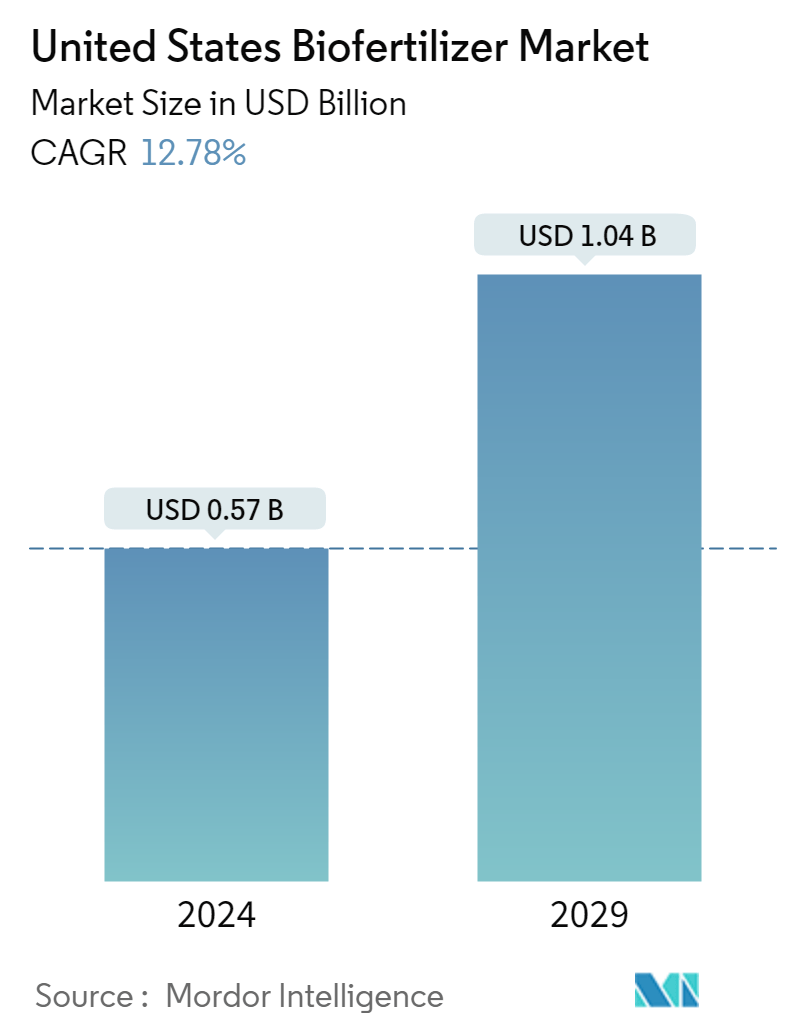
The United States Biofertilizer Market is projected to register a CAGR of 12.81%
- Rhizobium is the Largest Form : Rhizobium is mainly because it is a vital source of nitrogen to the majority of agricultural soils, which can fix nitrogen ranging from 200 to 300 kilograms annually.
- Rhizobium is the Fastest-growing Form : The rhizobium based biofertilizers have the ability to reduce the overall dependence on chemical fertilizers, by reducing the total cost of production for farmers.
- Row Crops is the Largest Crop Type : The most popular biofertilizers applied to cereals are those based on Rhizobium, Azotobacter, Azospirillum, and Cyanobacteria. Which have shown a positive yield responses.
- Row Crops is the Fastest-growing Crop Type : The growing trend of row crop value is mainly due to increasing trend in therow crop cultivation area, it has increased by about 24.9% during the period between 2017 to 2021.
US Bio Fertilizers Market Trends
This section covers the major market trends shaping the United States Biofertilizer Market according to our research experts:
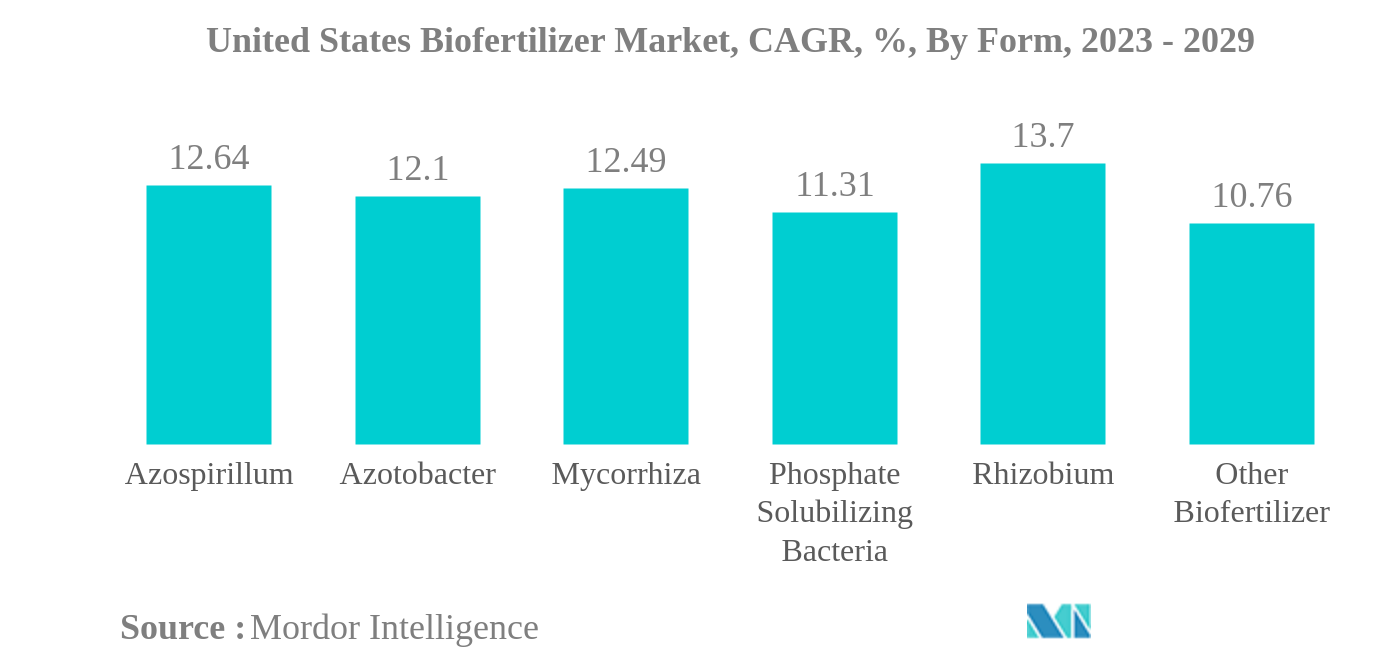
Rhizobium is the largest Form
- Biofertilizers are organic substances with living microorganisms that promote plant growth. The biofertilizer market value increased by about 49.1% during the historical period (between 2017 and 2022), which was attributed to various reasons like increasing awareness among farmers, increasing the overall registered organic farms in the United States, and a shift in demand for organically or sustainably grown commodities.
- An overall increasing trend is observed in the biofertilizer market both in terms of value and volume due to increasing demand for biofertilizers in the country.
- Rhizobium biofertilizer has the largest market share compared to other biofertilizers. It is anticipated to increase its market share further during the forecast period.
- Mycorrhiza occupied the second-largest market share in the biofertilizer market, followed by Rhizobium, and accounted for about 26.4% of the total market value in 2022. It was followed by Azospirillum, which accounted for 24.4% of the total biofertilizer market value in 2022.
- Continuous research is being conducted to develop strains that are biotic/abiotic stress tolerant. For instance, under salinity stress, Rhizobium trifolii inoculated with Trifoliumalexandrinum showed increased biomass and nodulation. Positive research findings and the presence of active companies in this segment are likely to drive the biofertilizer market to a large extent during the forecast period.
- The increasing awareness about the overuse of fertilizers among farmers and the government initiatives to support sustainable agricultural practices and organic farming resulted in a growing demand for biofertilizers. Therefore, the US biofertilizer market is anticipated to increase during the forecast period.
US Bio Fertilizers Industry Overview
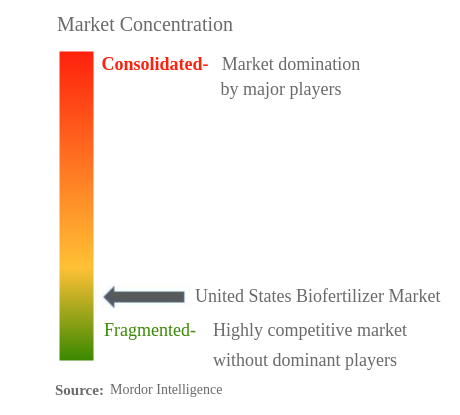
The United States Biofertilizer Market is fragmented, with the top five companies occupying 22.98%. The major players in this market are Kula Bio Inc., Novozymes, Rizobacter, Suståne Natural Fertilizer Inc. and Symborg Inc. (sorted alphabetically).
US Bio Fertilizers Market Leaders
Kula Bio Inc.
Novozymes
Rizobacter
Suståne Natural Fertilizer Inc.
Symborg Inc.
*Disclaimer: Major Players sorted in no particular order
US Bio Fertilizers Market News
- September 2022: Corteva Agriscience agreed to acquire Symborg Inc., which will strengthen Symborg's global presence with a strong distribution network of Corteva Agriscience.
- July 2022: A new granular inoculant called LALFIX® START SPHERICAL Granule was launched, which combines Bacillus velezensis, a plant growth-promoting microbe, with two distinct rhizobium strains. This powerful and well-tested PGPM boosts phosphorus solubilization and improves root mass.
- January 2022: Novozymes and AgroFresh formed a partnership to utilize the potential of biotechnology to continue improving post-harvest quality and reduce food waste. The company's intention was to satisfy increasing consumer demand for fruits and vegetables with less food waste and less impact on the environment.
US Bio Fertilizers Market Report - Table of Contents
EXECUTIVE SUMMARY & KEY FINDINGS
REPORT OFFERS
1. INTRODUCTION
1.1. Study Assumptions & Market Definition
1.2. Scope of the Study
1.3. Research Methodology
2. KEY INDUSTRY TRENDS
2.1. Area Under Organic Cultivation
2.2. Per Capita Spending On Organic Products
2.3. Regulatory Framework
2.4. Value Chain & Distribution Channel Analysis
3. MARKET SEGMENTATION
3.1. Form
3.1.1. Azospirillum
3.1.2. Azotobacter
3.1.3. Mycorrhiza
3.1.4. Phosphate Solubilizing Bacteria
3.1.5. Rhizobium
3.1.6. Other Biofertilizer
3.2. Crop Type
3.2.1. Cash Crops
3.2.2. Horticultural Crops
3.2.3. Row Crops
4. COMPETITIVE LANDSCAPE
4.1. Key Strategic Moves
4.2. Market Share Analysis
4.3. Company Landscape
4.4. Company Profiles
4.4.1. AgroLiquid
4.4.2. Indogulf BioAg LLC (Biotech Division of Indogulf Company)
4.4.3. Koppert Biological Systems Inc.
4.4.4. Kula Bio Inc.
4.4.5. Lallemand Inc.
4.4.6. Novozymes
4.4.7. Rizobacter
4.4.8. Suståne Natural Fertilizer Inc.
4.4.9. Symborg Inc.
4.4.10. The Andersons Inc.
5. KEY STRATEGIC QUESTIONS FOR AGRICULTURAL BIOLOGICALS CEOS
6. APPENDIX
6.1. Global Overview
6.1.1. Overview
6.1.2. Porter’s Five Forces Framework
6.1.3. Global Value Chain Analysis
6.1.4. Market Dynamics (DROs)
6.2. Sources & References
6.3. List of Tables & Figures
6.4. Primary Insights
6.5. Data Pack
6.6. Glossary of Terms
List of Tables & Figures
- Figure 1:
- UNITED STATES BIOFERTILIZER MARKET, AREA UNDER ORGANIC CULTIVATION, HECTARES, 2017 - 2022
- Figure 2:
- UNITED STATES BIOFERTILIZER MARKET, PER CAPITA SPENDING ON ORGANIC PRODUCTS, USD, 2017 - 2022
- Figure 3:
- UNITED STATES BIOFERTILIZER MARKET, VOLUME, METRIC TON, 2017 - 2029
- Figure 4:
- UNITED STATES BIOFERTILIZER MARKET, VALUE, USD, 2017 - 2029
- Figure 5:
- UNITED STATES BIOFERTILIZER MARKET, BY FORM, VOLUME, METRIC TON, 2017 - 2029
- Figure 6:
- UNITED STATES BIOFERTILIZER MARKET, BY FORM, VALUE, USD, 2017 - 2029
- Figure 7:
- UNITED STATES BIOFERTILIZER MARKET, VOLUME SHARE(%), BY FORM, 2017 - 2029
- Figure 8:
- UNITED STATES BIOFERTILIZER MARKET, VALUE SHARE(%), BY FORM, 2017 - 2029
- Figure 9:
- UNITED STATES BIOFERTILIZER MARKET, BY FORM, VOLUME, METRIC TON, 2017 - 2029
- Figure 10:
- UNITED STATES BIOFERTILIZER MARKET, BY FORM, VALUE, USD, 2017 - 2029
- Figure 11:
- UNITED STATES BIOFERTILIZER MARKET, VALUE SHARE(%), BY CROP TYPE, 2022 - 2029
- Figure 12:
- UNITED STATES BIOFERTILIZER MARKET, BY FORM, VOLUME, METRIC TON, 2017 - 2029
- Figure 13:
- UNITED STATES BIOFERTILIZER MARKET, BY FORM, VALUE, USD, 2017 - 2029
- Figure 14:
- UNITED STATES BIOFERTILIZER MARKET, VALUE SHARE(%), BY CROP TYPE, 2022 - 2029
- Figure 15:
- UNITED STATES BIOFERTILIZER MARKET, BY FORM, VOLUME, METRIC TON, 2017 - 2029
- Figure 16:
- UNITED STATES BIOFERTILIZER MARKET, BY FORM, VALUE, USD, 2017 - 2029
- Figure 17:
- UNITED STATES BIOFERTILIZER MARKET, VALUE SHARE(%), BY CROP TYPE, 2022 - 2029
- Figure 18:
- UNITED STATES BIOFERTILIZER MARKET, BY FORM, VOLUME, METRIC TON, 2017 - 2029
- Figure 19:
- UNITED STATES BIOFERTILIZER MARKET, BY FORM, VALUE, USD, 2017 - 2029
- Figure 20:
- UNITED STATES BIOFERTILIZER MARKET, VALUE SHARE(%), BY CROP TYPE, 2022 - 2029
- Figure 21:
- UNITED STATES BIOFERTILIZER MARKET, BY FORM, VOLUME, METRIC TON, 2017 - 2029
- Figure 22:
- UNITED STATES BIOFERTILIZER MARKET, BY FORM, VALUE, USD, 2017 - 2029
- Figure 23:
- UNITED STATES BIOFERTILIZER MARKET, VALUE SHARE(%), BY CROP TYPE, 2022 - 2029
- Figure 24:
- UNITED STATES BIOFERTILIZER MARKET, BY FORM, VOLUME, METRIC TON, 2017 - 2029
- Figure 25:
- UNITED STATES BIOFERTILIZER MARKET, BY FORM, VALUE, USD, 2017 - 2029
- Figure 26:
- UNITED STATES BIOFERTILIZER MARKET, VALUE SHARE(%), BY CROP TYPE, 2022 - 2029
- Figure 27:
- UNITED STATES BIOFERTILIZER MARKET, BY CROP TYPE, VOLUME, METRIC TON, 2017 - 2029
- Figure 28:
- UNITED STATES BIOFERTILIZER MARKET, BY CROP TYPE, VALUE, USD, 2017 - 2029
- Figure 29:
- UNITED STATES BIOFERTILIZER MARKET, VOLUME SHARE(%), BY CROP TYPE, 2017 - 2029
- Figure 30:
- UNITED STATES BIOFERTILIZER MARKET, VALUE SHARE(%), BY CROP TYPE, 2017 - 2029
- Figure 31:
- UNITED STATES BIOFERTILIZER MARKET, BY CROP TYPE, VOLUME, METRIC TON, 2017 - 2029
- Figure 32:
- UNITED STATES BIOFERTILIZER MARKET, BY CROP TYPE, VALUE, USD, 2017 - 2029
- Figure 33:
- UNITED STATES BIOFERTILIZER MARKET, VALUE SHARE(%), BY FORM, 2022 - 2029
- Figure 34:
- UNITED STATES BIOFERTILIZER MARKET, BY CROP TYPE, VOLUME, METRIC TON, 2017 - 2029
- Figure 35:
- UNITED STATES BIOFERTILIZER MARKET, BY CROP TYPE, VALUE, USD, 2017 - 2029
- Figure 36:
- UNITED STATES BIOFERTILIZER MARKET, VALUE SHARE(%), BY FORM, 2022 - 2029
- Figure 37:
- UNITED STATES BIOFERTILIZER MARKET, BY CROP TYPE, VOLUME, METRIC TON, 2017 - 2029
- Figure 38:
- UNITED STATES BIOFERTILIZER MARKET, BY CROP TYPE, VALUE, USD, 2017 - 2029
- Figure 39:
- UNITED STATES BIOFERTILIZER MARKET, VALUE SHARE(%), BY FORM, 2022 - 2029
- Figure 40:
- UNITED STATES BIOFERTILIZER MARKET, MOST ACTIVE COMPANIES, BY NUMBER OF STRATEGIC MOVES, 2017-2022
- Figure 41:
- UNITED STATES BIOFERTILIZER MARKET, MOST ADOPTED STRATEGIES, 2017-2022
- Figure 42:
- UNITED STATES BIOFERTILIZER MARKET SHARE(%), BY MAJOR PLAYERS, 2022
US Bio Fertilizers Industry Segmentation
Azospirillum, Azotobacter, Mycorrhiza, Phosphate Solubilizing Bacteria, Rhizobium are covered as segments by Form. Cash Crops, Horticultural Crops, Row Crops are covered as segments by Crop Type.| Form | |
| Azospirillum | |
| Azotobacter | |
| Mycorrhiza | |
| Phosphate Solubilizing Bacteria | |
| Rhizobium | |
| Other Biofertilizer |
| Crop Type | |
| Cash Crops | |
| Horticultural Crops | |
| Row Crops |
Market Definition
- AVERAGE DOSAGE RATE - This refers to the average volume of biofertilizers applied per hectare of farmland in the country.
- CROP TYPE - Row Crops: Cereals, Pulses, Oilseeds, and Forage Crops Horticulture: Fruits, and Vegetables, Cash Crops: Plantation Crops and Spices.
- FUNCTIONS - Biofertilizer
- MARKET ESTIMATION LEVEL - Market Estimations for various types of biofertilizers fertilizers has been done at the product-level.
Research Methodology
Mordor Intelligence follows a four-step methodology in all our reports.
- Step-1: Identify Key Variables: In order to build a robust forecasting methodology, the variables and factors identified in Step-1 are tested against available historical market numbers. Through an iterative process, the variables required for market forecast are set and the model is built on the basis of these variables.
- Step-2: Build a Market Model: Market-size estimations for the forecast years are in nominal terms. Inflation is not a part of the pricing, and the average selling price (ASP) is kept constant throughout the forecast period.
- Step-3: Validate and Finalize: In this important step, all market numbers, variables and analyst calls are validated through an extensive network of primary research experts from the market studied. The respondents are selected across levels and functions to generate a holistic picture of the market studied.
- Step-4: Research Outputs: Syndicated Reports, Custom Consulting Assignments, Databases & Subscription Platforms.


