Asia-pacific Engineering Plastics Market Size

| Icons | Lable | Value |
|---|---|---|
|
|
Study Period | 2017 - 2029 |
|
|
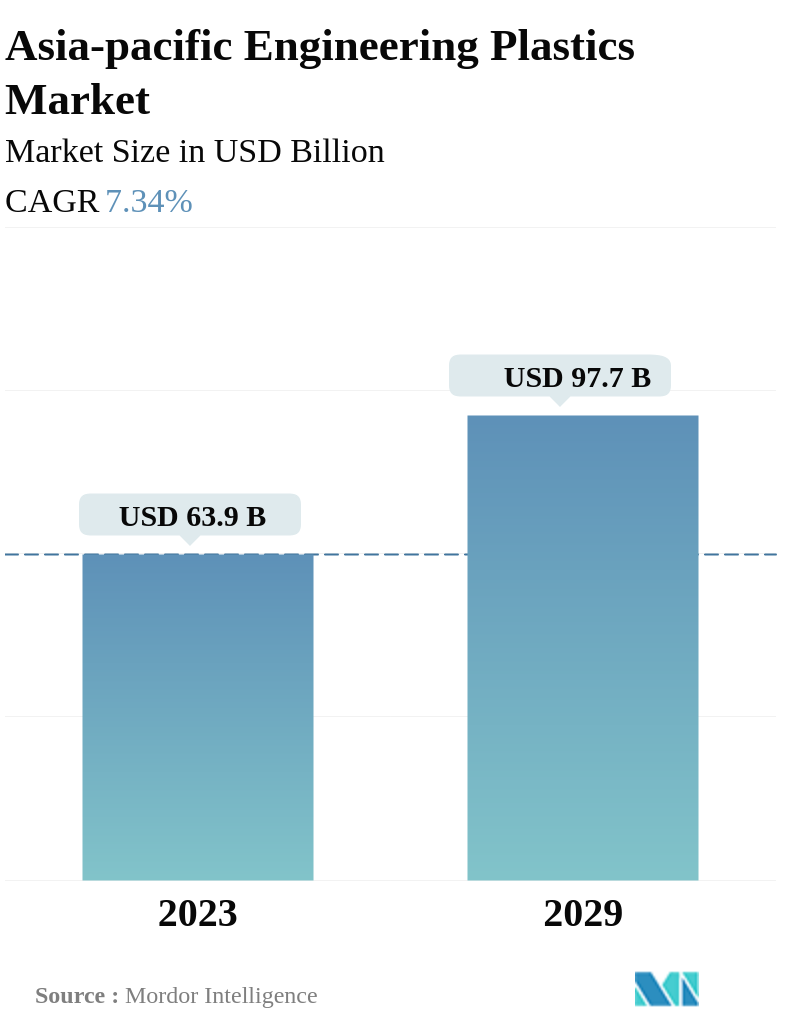
Market Size (2029) | USD 97.7 Billion |
|
|
Market Size (2023) | USD 63.9 Billion |
|
|
Largest Share by End User Industry | Electrical and Electronics |
|
|
CAGR (2023 - 2029) | 7.34 % |
|
|
Largest Share by Country | China |
Major Players |
||
|
|
||
|
*Disclaimer: Major Players sorted in no particular order |
Asia-pacific Engineering Plastics Market Analysis
The Asia-pacific Engineering Plastics Market is projected to register a CAGR of 7.34%
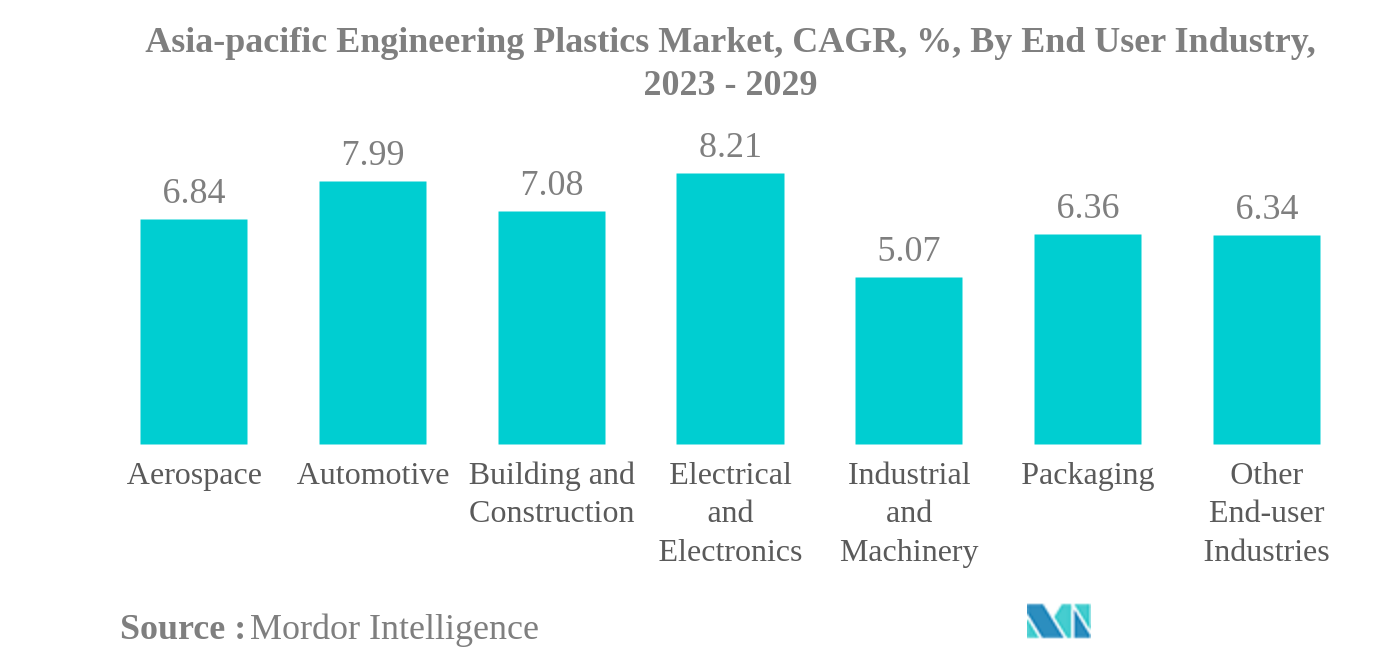
- Electrical and Electronics is the Largest End User Industry. The electronics segment occupied the highest market share due to the widespread applications of engineering plastics like ABS/SAN, PC, and PA in advanced and smart electrical devices.
- Electrical and Electronics is the Fastest-growing End User Industry. The electronics industry is expected to witness the fastest growth due to the properties of engineering plastics such as lightweight, higher flexibility, and good fire resistivity.
- Styrene Copolymers (ABS and SAN) is the Largest Resin Type. Styrene copolymers have wide applications in the automotive, aerospace, and electronics industries, and they accounted for the largest share in 2022.
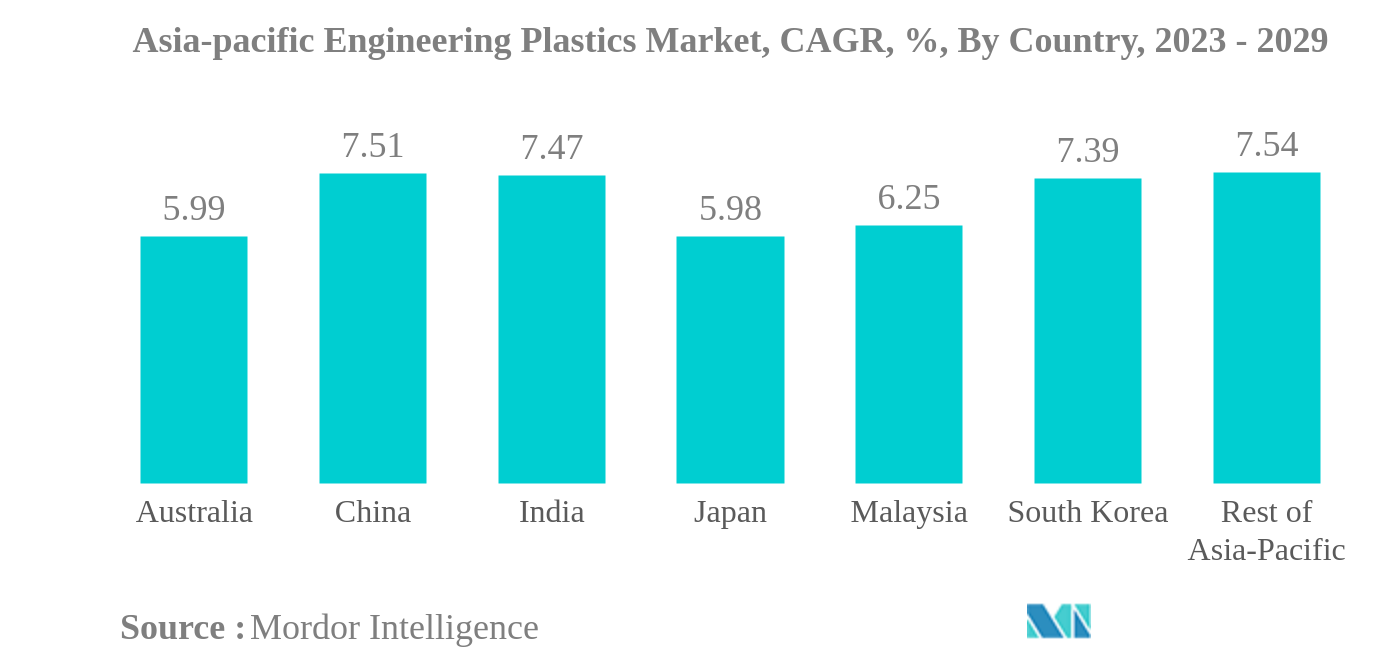
- China is the Largest Country. China dominated the market due to the high demand for engineering plastics in industries, including packaging, electrical and electronics, and automotive, along with strong economic growth in recent years.
Asia-pacific Engineering Plastics Market Trends
This section covers the major market trends shaping the Asia-pacific Engineering Plastics Market according to our research experts:
PACKAGING INDUSTRY TO LOSE ITS VOLUME SHARE TO ELECTRICAL AND ELECTRONICS INDUSTRY
- Engineering plastics are versatile, finding applications in everything from interior wall panels and doors in aerospace to rigid and flexible packaging. The Asia-Pacific engineering plastics market is primarily driven by the packaging, electrical and electronics, and automotive industries. In 2022, packaging and electrical and electronics accounted for approximately 43.80% and 31.32% of the total engineering plastics market volume, respectively.
- In 2020, the combined consumption revenue across all industries fell by 6.02% compared to the previous year due to disruptions in the global supply chain. However, the market recovered in 2021 and continued to grow steadily, increasing by 7.18% in 2022.
- The packaging industry is the largest end-user industry in the region in terms of volume share. However, according to revenue data, the electrical and electronics industry holds the largest share in the region due to the relatively low price of PET, among other engineering plastics, which are widely used in packaging applications. Significant changes in urbanization and family demographics have increased the demand for functional, prepackaged, and convenient food products. For instance, Asia-Pacific plastic packaging production reached a volume of 68 million tons in 2022, accounting for 51% of the global total.
- The electrical and electronic industry is the most promising market, with an expected CAGR of 8.21% by revenue during the forecast period (2023-2029). Electronics component production revenue in the region is projected to reach USD 6.74 trillion by 2029, driven by the increasing demand for smart electronic devices, the growing demand for electric vehicles, autonomous robots, and advanced defense technologies.
CHINA AND JAPAN TO REMAIN AS LARGEST DEMAND GENRATORS
- Asia-Pacific accounted for 56.7% by volume of the consumption of engineering plastics globally in 2022. Engineering plastics exhibit versatile properties due to which they find applications in various industries, such as automotive, packaging, and electrical and electronics.
- China is the largest consumer of engineering plastics in the region owing to its growing electrical and electronics, packaging, automotive, and other industries. In 2022, the Chinese electrical and electronics industry held a revenue share of 29.26% compared to the overall Asia-Pacific region. In China, the revenue from electrical and electronic component production accounted for USD 2.92 billion in 2022.
- Japan is the second-largest consumer of engineering plastics in the region. The country registered a revenue share of 8.29% in 2022 due to its rapidly growing construction and electrical and electronics industries. In 2022, the new construction floor area of the Japanese building and construction industry increased at a rate of 7.47% and 4.11% in 2021 and 2022 by revenue, respectively. The rising electrical and electronics component production is projected to drive the demand for engineering plastics in the country in the future.
- China is expected to witness the fastest growth in the Asia-Pacific engineering plastics market, with a CAGR of 7.50% in terms of value during the forecast period, owing to the rapid growth of industries like automotive and electronics. From 2022 onward, China lifted the restrictions on foreign investment in passenger car manufacturing, allowing for maximum investment in joint ventures between the Chinese government and automotive engineering companies to reach a 50:50 ratio. This change presents an opportunity for growth in the Chinese automotive industry through increased investment.
Asia-pacific Engineering Plastics Industry Overview
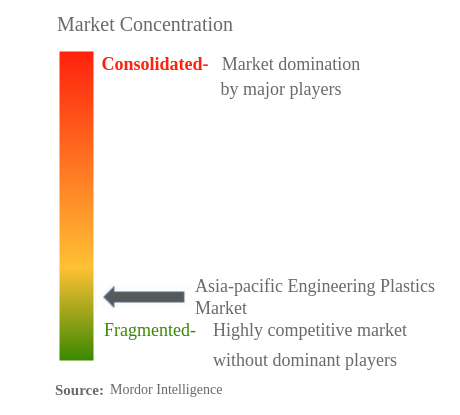
The Asia-pacific Engineering Plastics Market is fragmented, with the top five companies occupying 22.59%. The major players in this market are CHIMEI, China Resources (Holdings) Co.,Ltd., Far Eastern New Century Corporation, LG CHEM and Sanfame Group (sorted alphabetically).
Asia-pacific Engineering Plastics Market Leaders
CHIMEI
China Resources (Holdings) Co.,Ltd.
Far Eastern New Century Corporation
LG CHEM
Sanfame Group
*Disclaimer: Major Players sorted in no particular order
Asia-pacific Engineering Plastics Market News
- February 2023: Covestro AG introduced Makrolon 3638 polycarbonate for healthcare and life sciences applications such as drug delivery devices, wellness and wearable devices, and single-use containers for biopharmaceutical manufacturing.
- August 2022: Toray Industries Inc. introduced Toraypearl PA6, which claims to provide outstanding high strength, heat resistance, and surface smoothness for powder bed fusion 3D printers.
- August 2022: Covestro AG announced plans to build its first dedicated line for the mechanical recycling (MCR) of polycarbonates in Shanghai, China, to create more sustainable solutions, primarily for electrical and electronic, automotive, and consumer goods applications.
Asia-pacific Engineering Plastics Market Report - Table of Contents
1. INTRODUCTION
1.1. Study Assumptions & Market Definition
1.2. Scope of the Study
1.3. Research Methodology
2. KEY INDUSTRY TRENDS
2.1. End User Trends
2.2. Import And Export Trends
2.3. Price Trends
2.4. Recycling Overview
2.5. Regulatory Framework
2.6. Value Chain & Distribution Channel Analysis
3. MARKET SEGMENTATION
3.1. End User Industry
3.1.1. Aerospace
3.1.2. Automotive
3.1.3. Building and Construction
3.1.4. Electrical and Electronics
3.1.5. Industrial and Machinery
3.1.6. Packaging
3.1.7. Other End-user Industries
3.2. Resin Type
3.2.1. Fluoropolymer
3.2.1.1. By Sub Resin Type
3.2.1.1.1. Ethylenetetrafluoroethylene (ETFE)
3.2.1.1.2. Fluorinated Ethylene-propylene (FEP)
3.2.1.1.3. Polytetrafluoroethylene (PTFE)
3.2.1.1.4. Polyvinylfluoride (PVF)
3.2.1.1.5. Polyvinylidene Fluoride (PVDF)
3.2.1.1.6. Other Sub Resin Types
3.2.2. Liquid Crystal Polymer (LCP)
3.2.3. Polyamide (PA)
3.2.3.1. By Sub Resin Type
3.2.3.1.1. Aramid
3.2.3.1.2. Polyamide (PA) 6
3.2.3.1.3. Polyamide (PA) 66
3.2.3.1.4. Polyphthalamide
3.2.4. Polybutylene Terephthalate (PBT)
3.2.5. Polycarbonate (PC)
3.2.6. Polyether Ether Ketone (PEEK)
3.2.7. Polyethylene Terephthalate (PET)
3.2.8. Polyimide (PI)
3.2.9. Polymethyl Methacrylate (PMMA)
3.2.10. Polyoxymethylene (POM)
3.2.11. Styrene Copolymers (ABS and SAN)
3.3. Country
3.3.1. Australia
3.3.2. China
3.3.3. India
3.3.4. Japan
3.3.5. Malaysia
3.3.6. South Korea
3.3.7. Rest of Asia-Pacific
4. COMPETITIVE LANDSCAPE
4.1. Key Strategic Moves
4.2. Market Share Analysis
4.3. Company Landscape
4.4. Company Profiles
4.4.1. Asahi Kasei Corporation
4.4.2. CHIMEI
4.4.3. China Petroleum & Chemical Corporation
4.4.4. China Resources (Holdings) Co.,Ltd.
4.4.5. Covestro AG
4.4.6. Far Eastern New Century Corporation
4.4.7. Formosa Plastics Group
4.4.8. LG CHEM
4.4.9. Lotte Chemical
4.4.10. Mitsubishi Chemical Corporation
4.4.11. Sanfame Group
4.4.12. Sinochem
4.4.13. Solvay
4.4.14. Sumitomo Chemical Co., Ltd.
4.4.15. TORAY INDUSTRIES, INC.
5. KEY STRATEGIC QUESTIONS FOR ENGINEERING PLASTICS CEOS
6. APPENDIX
6.1. Global Overview
6.1.1. Overview
6.1.2. Porter’s Five Forces Framework
6.1.3. Global Value Chain Analysis
6.1.4. Market Dynamics (DROs)
6.2. Sources & References
6.3. List of Tables & Figures
6.4. Primary Insights
6.5. Data Pack
6.6. Glossary of Terms
List of Tables & Figures
- Figure 1:
- ASIA-PACIFIC AEROSPACE COMPONENT PRODUCTION, VALUE IN USD, 2017-2029
- Figure 2:
- ASIA-PACIFIC AUTOMOBILE PRODUCTION, VOLUME IN UNITS, 2017-2029
- Figure 3:
- ASIA-PACIFIC NEW CONSTRUCTION FLOOR AREA, IN SQUARE FEET, 2017-2029
- Figure 4:
- ASIA-PACIFIC ELECTRICAL AND ELECTRONICS PRODUCTION, VALUE IN USD, 2017-2029
- Figure 5:
- ASIA-PACIFIC PLASTIC PACKAGING PRODUCTION, VOLUME IN TONS, 2017-2029
- Figure 6:
- ASIA-PACIFIC FLUOROPOLYMER TRADE IMPORT TRENDS, BY TOP COUNTRIES, VALUE IN USD, 2017-2021
- Figure 7:
- ASIA-PACIFIC FLUOROPOLYMER TRADE EXPORT TRENDS, BY TOP COUNTRIES, VALUE IN USD, 2017-2021
- Figure 8:
- ASIA-PACIFIC POLYAMIDE (PA) TRADE IMPORT TRENDS, BY TOP COUNTRIES, VALUE IN USD, 2017-2021
- Figure 9:
- ASIA-PACIFIC POLYAMIDE (PA) TRADE EXPORT TRENDS, BY TOP COUNTRIES, VALUE IN USD, 2017-2021
- Figure 10:
- ASIA-PACIFIC POLYCARBONATE (PC) TRADE IMPORT TRENDS, BY TOP COUNTRIES, VALUE IN USD, 2017-2021
- Figure 11:
- ASIA-PACIFIC POLYCARBONATE (PC) TRADE EXPORT TRENDS, BY TOP COUNTRIES, VALUE IN USD, 2017-2021
- Figure 12:
- ASIA-PACIFIC POLYETHYLENE TEREPHTHALATE (PET) TRADE IMPORT TRENDS, BY TOP COUNTRIES, VALUE IN USD, 2017-2021
- Figure 13:
- ASIA-PACIFIC POLYETHYLENE TEREPHTHALATE (PET) TRADE EXPORT TRENDS, BY TOP COUNTRIES, VALUE IN USD, 2017-2021
- Figure 14:
- ASIA-PACIFIC POLYMETHYL METHACRYLATE (PMMA) TRADE IMPORT TRENDS, BY TOP COUNTRIES, VALUE IN USD, 2017-2021
- Figure 15:
- ASIA-PACIFIC POLYMETHYL METHACRYLATE (PMMA) TRADE EXPORT TRENDS, BY TOP COUNTRIES, VALUE IN USD, 2017-2021
- Figure 16:
- ASIA-PACIFIC POLYOXYMETHYLENE (POM) TRADE IMPORT TRENDS, BY TOP COUNTRIES, VALUE IN USD, 2017-2021
- Figure 17:
- ASIA-PACIFIC POLYOXYMETHYLENE (POM) TRADE EXPORT TRENDS, BY TOP COUNTRIES, VALUE IN USD, 2017-2021
- Figure 18:
- ASIA-PACIFIC STYRENE COPOLYMERS (ABS AND SAN) TRADE IMPORT TRENDS, BY TOP COUNTRIES, VALUE IN USD, 2017-2021
- Figure 19:
- ASIA-PACIFIC STYRENE COPOLYMERS (ABS AND SAN) TRADE EXPORT TRENDS, BY TOP COUNTRIES, VALUE IN USD, 2017-2021
- Figure 20:
- CHINA ENGINEERING PLASTICS MARKET, PRICE TRENDS, BY RESIN TYPE, USD PER KG, 2017-2021
- Figure 21:
- INDIA ENGINEERING PLASTICS MARKET, PRICE TRENDS, BY RESIN TYPE, USD PER KG, 2017-2021
- Figure 22:
- ASIA-PACIFIC ENGINEERING PLASTICS MARKET, VOLUME, TONS, 2017 - 2029
- Figure 23:
- ASIA-PACIFIC ENGINEERING PLASTICS MARKET, VALUE, USD, 2017 - 2029
- Figure 24:
- ASIA-PACIFIC ENGINEERING PLASTICS MARKET, BY END USER INDUSTRY, VOLUME, TONS, 2017 - 2029
- Figure 25:
- ASIA-PACIFIC ENGINEERING PLASTICS MARKET, BY END USER INDUSTRY, VALUE, USD, 2017 - 2029
- Figure 26:
- ASIA-PACIFIC ENGINEERING PLASTICS MARKET, BY END USER INDUSTRY, VOLUME SHARE(%), 2017 - 2029
- Figure 27:
- ASIA-PACIFIC ENGINEERING PLASTICS MARKET, BY END USER INDUSTRY, VALUE SHARE(%), 2017 - 2029
- Figure 28:
- ASIA-PACIFIC ENGINEERING PLASTICS MARKET, AEROSPACE, VOLUME, TONS, 2017 - 2029
- Figure 29:
- ASIA-PACIFIC ENGINEERING PLASTICS MARKET, AEROSPACE, VALUE, USD, 2017 - 2029
- Figure 30:
- ASIA-PACIFIC ENGINEERING PLASTICS MARKET, AEROSPACE, BY RESIN TYPE, VALUE SHARE(%), 2022 VS 2029
- Figure 31:
- ASIA-PACIFIC ENGINEERING PLASTICS MARKET, AUTOMOTIVE, VOLUME, TONS, 2017 - 2029
- Figure 32:
- ASIA-PACIFIC ENGINEERING PLASTICS MARKET, AUTOMOTIVE, VALUE, USD, 2017 - 2029
- Figure 33:
- ASIA-PACIFIC ENGINEERING PLASTICS MARKET, AUTOMOTIVE, BY RESIN TYPE, VALUE SHARE(%), 2022 VS 2029
- Figure 34:
- ASIA-PACIFIC ENGINEERING PLASTICS MARKET, BUILDING AND CONSTRUCTION, VOLUME, TONS, 2017 - 2029
- Figure 35:
- ASIA-PACIFIC ENGINEERING PLASTICS MARKET, BUILDING AND CONSTRUCTION, VALUE, USD, 2017 - 2029
- Figure 36:
- ASIA-PACIFIC ENGINEERING PLASTICS MARKET, BUILDING AND CONSTRUCTION, BY RESIN TYPE, VALUE SHARE(%), 2022 VS 2029
- Figure 37:
- ASIA-PACIFIC ENGINEERING PLASTICS MARKET, ELECTRICAL AND ELECTRONICS, VOLUME, TONS, 2017 - 2029
- Figure 38:
- ASIA-PACIFIC ENGINEERING PLASTICS MARKET, ELECTRICAL AND ELECTRONICS, VALUE, USD, 2017 - 2029
- Figure 39:
- ASIA-PACIFIC ENGINEERING PLASTICS MARKET, ELECTRICAL AND ELECTRONICS, BY RESIN TYPE, VALUE SHARE(%), 2022 VS 2029
- Figure 40:
- ASIA-PACIFIC ENGINEERING PLASTICS MARKET, INDUSTRIAL AND MACHINERY, VOLUME, TONS, 2017 - 2029
- Figure 41:
- ASIA-PACIFIC ENGINEERING PLASTICS MARKET, INDUSTRIAL AND MACHINERY, VALUE, USD, 2017 - 2029
- Figure 42:
- ASIA-PACIFIC ENGINEERING PLASTICS MARKET, INDUSTRIAL AND MACHINERY, BY RESIN TYPE, VALUE SHARE(%), 2022 VS 2029
- Figure 43:
- ASIA-PACIFIC ENGINEERING PLASTICS MARKET, PACKAGING, VOLUME, TONS, 2017 - 2029
- Figure 44:
- ASIA-PACIFIC ENGINEERING PLASTICS MARKET, PACKAGING, VALUE, USD, 2017 - 2029
- Figure 45:
- ASIA-PACIFIC ENGINEERING PLASTICS MARKET, PACKAGING, BY RESIN TYPE, VALUE SHARE(%), 2022 VS 2029
- Figure 46:
- ASIA-PACIFIC ENGINEERING PLASTICS MARKET, OTHER END-USER INDUSTRIES, VOLUME, TONS, 2017 - 2029
- Figure 47:
- ASIA-PACIFIC ENGINEERING PLASTICS MARKET, OTHER END-USER INDUSTRIES, VALUE, USD, 2017 - 2029
- Figure 48:
- ASIA-PACIFIC ENGINEERING PLASTICS MARKET, OTHER END-USER INDUSTRIES, BY RESIN TYPE, VALUE SHARE(%), 2022 VS 2029
- Figure 49:
- ASIA-PACIFIC ENGINEERING PLASTICS MARKET, BY RESIN TYPE, VOLUME, TONS, 2017 - 2029
- Figure 50:
- ASIA-PACIFIC ENGINEERING PLASTICS MARKET, BY RESIN TYPE, VALUE, USD, 2017 - 2029
- Figure 51:
- ASIA-PACIFIC ENGINEERING PLASTICS MARKET, BY RESIN TYPE, VOLUME SHARE(%), 2017 - 2029
- Figure 52:
- ASIA-PACIFIC ENGINEERING PLASTICS MARKET, BY RESIN TYPE, VALUE SHARE(%), 2017 - 2029
- Figure 53:
- ASIA-PACIFIC ENGINEERING PLASTICS MARKET, BY SUB RESIN TYPE, VOLUME, TONS, 2017 - 2029
- Figure 54:
- ASIA-PACIFIC ENGINEERING PLASTICS MARKET, BY SUB RESIN TYPE, VALUE, USD, 2017 - 2029
- Figure 55:
- ASIA-PACIFIC ENGINEERING PLASTICS MARKET, BY SUB RESIN TYPE, VOLUME SHARE(%), 2017 - 2029
- Figure 56:
- ASIA-PACIFIC ENGINEERING PLASTICS MARKET, BY SUB RESIN TYPE, VALUE SHARE(%), 2017 - 2029
- Figure 57:
- ASIA-PACIFIC ENGINEERING PLASTICS MARKET, ETHYLENETETRAFLUOROETHYLENE (ETFE), VOLUME, TONS, 2017 - 2029
- Figure 58:
- ASIA-PACIFIC ENGINEERING PLASTICS MARKET, ETHYLENETETRAFLUOROETHYLENE (ETFE), VALUE, USD, 2017 - 2029
- Figure 59:
- ASIA-PACIFIC ENGINEERING PLASTICS MARKET, ETHYLENETETRAFLUOROETHYLENE (ETFE), BY END USER INDUSTRY, VALUE SHARE(%), 2022 VS 2029
- Figure 60:
- ASIA-PACIFIC ENGINEERING PLASTICS MARKET, FLUORINATED ETHYLENE-PROPYLENE (FEP), VOLUME, TONS, 2017 - 2029
- Figure 61:
- ASIA-PACIFIC ENGINEERING PLASTICS MARKET, FLUORINATED ETHYLENE-PROPYLENE (FEP), VALUE, USD, 2017 - 2029
- Figure 62:
- ASIA-PACIFIC ENGINEERING PLASTICS MARKET, FLUORINATED ETHYLENE-PROPYLENE (FEP), BY END USER INDUSTRY, VALUE SHARE(%), 2022 VS 2029
- Figure 63:
- ASIA-PACIFIC ENGINEERING PLASTICS MARKET, POLYTETRAFLUOROETHYLENE (PTFE), VOLUME, TONS, 2017 - 2029
- Figure 64:
- ASIA-PACIFIC ENGINEERING PLASTICS MARKET, POLYTETRAFLUOROETHYLENE (PTFE), VALUE, USD, 2017 - 2029
- Figure 65:
- ASIA-PACIFIC ENGINEERING PLASTICS MARKET, POLYTETRAFLUOROETHYLENE (PTFE), BY END USER INDUSTRY, VALUE SHARE(%), 2022 VS 2029
- Figure 66:
- ASIA-PACIFIC ENGINEERING PLASTICS MARKET, POLYVINYLFLUORIDE (PVF), VOLUME, TONS, 2017 - 2029
- Figure 67:
- ASIA-PACIFIC ENGINEERING PLASTICS MARKET, POLYVINYLFLUORIDE (PVF), VALUE, USD, 2017 - 2029
- Figure 68:
- ASIA-PACIFIC ENGINEERING PLASTICS MARKET, POLYVINYLFLUORIDE (PVF), BY END USER INDUSTRY, VALUE SHARE(%), 2022 VS 2029
- Figure 69:
- ASIA-PACIFIC ENGINEERING PLASTICS MARKET, POLYVINYLIDENE FLUORIDE (PVDF), VOLUME, TONS, 2017 - 2029
- Figure 70:
- ASIA-PACIFIC ENGINEERING PLASTICS MARKET, POLYVINYLIDENE FLUORIDE (PVDF), VALUE, USD, 2017 - 2029
- Figure 71:
- ASIA-PACIFIC ENGINEERING PLASTICS MARKET, POLYVINYLIDENE FLUORIDE (PVDF), BY END USER INDUSTRY, VALUE SHARE(%), 2022 VS 2029
- Figure 72:
- ASIA-PACIFIC ENGINEERING PLASTICS MARKET, OTHER SUB RESIN TYPES, VOLUME, TONS, 2017 - 2029
- Figure 73:
- ASIA-PACIFIC ENGINEERING PLASTICS MARKET, OTHER SUB RESIN TYPES, VALUE, USD, 2017 - 2029
- Figure 74:
- ASIA-PACIFIC ENGINEERING PLASTICS MARKET, OTHER SUB RESIN TYPES, BY END USER INDUSTRY, VALUE SHARE(%), 2022 VS 2029
- Figure 75:
- ASIA-PACIFIC ENGINEERING PLASTICS MARKET, LIQUID CRYSTAL POLYMER (LCP), VOLUME, TONS, 2017 - 2029
- Figure 76:
- ASIA-PACIFIC ENGINEERING PLASTICS MARKET, LIQUID CRYSTAL POLYMER (LCP), VALUE, USD, 2017 - 2029
- Figure 77:
- ASIA-PACIFIC ENGINEERING PLASTICS MARKET, LIQUID CRYSTAL POLYMER (LCP), BY END USER INDUSTRY, VALUE SHARE(%), 2022 VS 2029
- Figure 78:
- ASIA-PACIFIC ENGINEERING PLASTICS MARKET, BY SUB RESIN TYPE, VOLUME, TONS, 2017 - 2029
- Figure 79:
- ASIA-PACIFIC ENGINEERING PLASTICS MARKET, BY SUB RESIN TYPE, VALUE, USD, 2017 - 2029
- Figure 80:
- ASIA-PACIFIC ENGINEERING PLASTICS MARKET, BY SUB RESIN TYPE, VOLUME SHARE(%), 2017 - 2029
- Figure 81:
- ASIA-PACIFIC ENGINEERING PLASTICS MARKET, BY SUB RESIN TYPE, VALUE SHARE(%), 2017 - 2029
- Figure 82:
- ASIA-PACIFIC ENGINEERING PLASTICS MARKET, ARAMID, VOLUME, TONS, 2017 - 2029
- Figure 83:
- ASIA-PACIFIC ENGINEERING PLASTICS MARKET, ARAMID, VALUE, USD, 2017 - 2029
- Figure 84:
- ASIA-PACIFIC ENGINEERING PLASTICS MARKET, ARAMID, BY END USER INDUSTRY, VALUE SHARE(%), 2022 VS 2029
- Figure 85:
- ASIA-PACIFIC ENGINEERING PLASTICS MARKET, POLYAMIDE (PA) 6, VOLUME, TONS, 2017 - 2029
- Figure 86:
- ASIA-PACIFIC ENGINEERING PLASTICS MARKET, POLYAMIDE (PA) 6, VALUE, USD, 2017 - 2029
- Figure 87:
- ASIA-PACIFIC ENGINEERING PLASTICS MARKET, POLYAMIDE (PA) 6, BY END USER INDUSTRY, VALUE SHARE(%), 2022 VS 2029
- Figure 88:
- ASIA-PACIFIC ENGINEERING PLASTICS MARKET, POLYAMIDE (PA) 66, VOLUME, TONS, 2017 - 2029
- Figure 89:
- ASIA-PACIFIC ENGINEERING PLASTICS MARKET, POLYAMIDE (PA) 66, VALUE, USD, 2017 - 2029
- Figure 90:
- ASIA-PACIFIC ENGINEERING PLASTICS MARKET, POLYAMIDE (PA) 66, BY END USER INDUSTRY, VALUE SHARE(%), 2022 VS 2029
- Figure 91:
- ASIA-PACIFIC ENGINEERING PLASTICS MARKET, POLYPHTHALAMIDE, VOLUME, TONS, 2017 - 2029
- Figure 92:
- ASIA-PACIFIC ENGINEERING PLASTICS MARKET, POLYPHTHALAMIDE, VALUE, USD, 2017 - 2029
- Figure 93:
- ASIA-PACIFIC ENGINEERING PLASTICS MARKET, POLYPHTHALAMIDE, BY END USER INDUSTRY, VALUE SHARE(%), 2022 VS 2029
- Figure 94:
- ASIA-PACIFIC ENGINEERING PLASTICS MARKET, POLYBUTYLENE TEREPHTHALATE (PBT), VOLUME, TONS, 2017 - 2029
- Figure 95:
- ASIA-PACIFIC ENGINEERING PLASTICS MARKET, POLYBUTYLENE TEREPHTHALATE (PBT), VALUE, USD, 2017 - 2029
- Figure 96:
- ASIA-PACIFIC ENGINEERING PLASTICS MARKET, POLYBUTYLENE TEREPHTHALATE (PBT), BY END USER INDUSTRY, VALUE SHARE(%), 2022 VS 2029
- Figure 97:
- ASIA-PACIFIC ENGINEERING PLASTICS MARKET, POLYCARBONATE (PC), VOLUME, TONS, 2017 - 2029
- Figure 98:
- ASIA-PACIFIC ENGINEERING PLASTICS MARKET, POLYCARBONATE (PC), VALUE, USD, 2017 - 2029
- Figure 99:
- ASIA-PACIFIC ENGINEERING PLASTICS MARKET, POLYCARBONATE (PC), BY END USER INDUSTRY, VALUE SHARE(%), 2022 VS 2029
- Figure 100:
- ASIA-PACIFIC ENGINEERING PLASTICS MARKET, POLYETHER ETHER KETONE (PEEK), VOLUME, TONS, 2017 - 2029
- Figure 101:
- ASIA-PACIFIC ENGINEERING PLASTICS MARKET, POLYETHER ETHER KETONE (PEEK), VALUE, USD, 2017 - 2029
- Figure 102:
- ASIA-PACIFIC ENGINEERING PLASTICS MARKET, POLYETHER ETHER KETONE (PEEK), BY END USER INDUSTRY, VALUE SHARE(%), 2022 VS 2029
- Figure 103:
- ASIA-PACIFIC ENGINEERING PLASTICS MARKET, POLYETHYLENE TEREPHTHALATE (PET), VOLUME, TONS, 2017 - 2029
- Figure 104:
- ASIA-PACIFIC ENGINEERING PLASTICS MARKET, POLYETHYLENE TEREPHTHALATE (PET), VALUE, USD, 2017 - 2029
- Figure 105:
- ASIA-PACIFIC ENGINEERING PLASTICS MARKET, POLYETHYLENE TEREPHTHALATE (PET), BY END USER INDUSTRY, VALUE SHARE(%), 2022 VS 2029
- Figure 106:
- ASIA-PACIFIC ENGINEERING PLASTICS MARKET, POLYIMIDE (PI), VOLUME, TONS, 2017 - 2029
- Figure 107:
- ASIA-PACIFIC ENGINEERING PLASTICS MARKET, POLYIMIDE (PI), VALUE, USD, 2017 - 2029
- Figure 108:
- ASIA-PACIFIC ENGINEERING PLASTICS MARKET, POLYIMIDE (PI), BY END USER INDUSTRY, VALUE SHARE(%), 2022 VS 2029
- Figure 109:
- ASIA-PACIFIC ENGINEERING PLASTICS MARKET, POLYMETHYL METHACRYLATE (PMMA), VOLUME, TONS, 2017 - 2029
- Figure 110:
- ASIA-PACIFIC ENGINEERING PLASTICS MARKET, POLYMETHYL METHACRYLATE (PMMA), VALUE, USD, 2017 - 2029
- Figure 111:
- ASIA-PACIFIC ENGINEERING PLASTICS MARKET, POLYMETHYL METHACRYLATE (PMMA), BY END USER INDUSTRY, VALUE SHARE(%), 2022 VS 2029
- Figure 112:
- ASIA-PACIFIC ENGINEERING PLASTICS MARKET, POLYOXYMETHYLENE (POM), VOLUME, TONS, 2017 - 2029
- Figure 113:
- ASIA-PACIFIC ENGINEERING PLASTICS MARKET, POLYOXYMETHYLENE (POM), VALUE, USD, 2017 - 2029
- Figure 114:
- ASIA-PACIFIC ENGINEERING PLASTICS MARKET, POLYOXYMETHYLENE (POM), BY END USER INDUSTRY, VALUE SHARE(%), 2022 VS 2029
- Figure 115:
- ASIA-PACIFIC ENGINEERING PLASTICS MARKET, STYRENE COPOLYMERS (ABS AND SAN), VOLUME, TONS, 2017 - 2029
- Figure 116:
- ASIA-PACIFIC ENGINEERING PLASTICS MARKET, STYRENE COPOLYMERS (ABS AND SAN), VALUE, USD, 2017 - 2029
- Figure 117:
- ASIA-PACIFIC ENGINEERING PLASTICS MARKET, STYRENE COPOLYMERS (ABS AND SAN), BY END USER INDUSTRY, VALUE SHARE(%), 2022 VS 2029
- Figure 118:
- ASIA-PACIFIC ENGINEERING PLASTICS MARKET, BY COUNTRY, VOLUME, TONS, 2017 - 2029
- Figure 119:
- ASIA-PACIFIC ENGINEERING PLASTICS MARKET, BY COUNTRY, VALUE, USD, 2017 - 2029
- Figure 120:
- ASIA-PACIFIC ENGINEERING PLASTICS MARKET, BY COUNTRY, VOLUME SHARE(%), 2017 - 2029
- Figure 121:
- ASIA-PACIFIC ENGINEERING PLASTICS MARKET, BY COUNTRY, VALUE SHARE(%), 2017 - 2029
- Figure 122:
- ASIA-PACIFIC ENGINEERING PLASTICS MARKET, AUSTRALIA, VOLUME, TONS, 2017 - 2029
- Figure 123:
- ASIA-PACIFIC ENGINEERING PLASTICS MARKET, AUSTRALIA, VALUE, USD, 2017 - 2029
- Figure 124:
- ASIA-PACIFIC ENGINEERING PLASTICS MARKET, AUSTRALIA, BY END USER INDUSTRY, VALUE SHARE(%), 2022 VS 2029
- Figure 125:
- ASIA-PACIFIC ENGINEERING PLASTICS MARKET, CHINA, VOLUME, TONS, 2017 - 2029
- Figure 126:
- ASIA-PACIFIC ENGINEERING PLASTICS MARKET, CHINA, VALUE, USD, 2017 - 2029
- Figure 127:
- ASIA-PACIFIC ENGINEERING PLASTICS MARKET, CHINA, BY END USER INDUSTRY, VALUE SHARE(%), 2022 VS 2029
- Figure 128:
- ASIA-PACIFIC ENGINEERING PLASTICS MARKET, INDIA, VOLUME, TONS, 2017 - 2029
- Figure 129:
- ASIA-PACIFIC ENGINEERING PLASTICS MARKET, INDIA, VALUE, USD, 2017 - 2029
- Figure 130:
- ASIA-PACIFIC ENGINEERING PLASTICS MARKET, INDIA, BY END USER INDUSTRY, VALUE SHARE(%), 2022 VS 2029
- Figure 131:
- ASIA-PACIFIC ENGINEERING PLASTICS MARKET, JAPAN, VOLUME, TONS, 2017 - 2029
- Figure 132:
- ASIA-PACIFIC ENGINEERING PLASTICS MARKET, JAPAN, VALUE, USD, 2017 - 2029
- Figure 133:
- ASIA-PACIFIC ENGINEERING PLASTICS MARKET, JAPAN, BY END USER INDUSTRY, VALUE SHARE(%), 2022 VS 2029
- Figure 134:
- ASIA-PACIFIC ENGINEERING PLASTICS MARKET, MALAYSIA, VOLUME, TONS, 2017 - 2029
- Figure 135:
- ASIA-PACIFIC ENGINEERING PLASTICS MARKET, MALAYSIA, VALUE, USD, 2017 - 2029
- Figure 136:
- ASIA-PACIFIC ENGINEERING PLASTICS MARKET, MALAYSIA, BY END USER INDUSTRY, VALUE SHARE(%), 2022 VS 2029
- Figure 137:
- ASIA-PACIFIC ENGINEERING PLASTICS MARKET, SOUTH KOREA, VOLUME, TONS, 2017 - 2029
- Figure 138:
- ASIA-PACIFIC ENGINEERING PLASTICS MARKET, SOUTH KOREA, VALUE, USD, 2017 - 2029
- Figure 139:
- ASIA-PACIFIC ENGINEERING PLASTICS MARKET, SOUTH KOREA, BY END USER INDUSTRY, VALUE SHARE(%), 2022 VS 2029
- Figure 140:
- ASIA-PACIFIC ENGINEERING PLASTICS MARKET, REST OF ASIA-PACIFIC, VOLUME, TONS, 2017 - 2029
- Figure 141:
- ASIA-PACIFIC ENGINEERING PLASTICS MARKET, REST OF ASIA-PACIFIC, VALUE, USD, 2017 - 2029
- Figure 142:
- ASIA-PACIFIC ENGINEERING PLASTICS MARKET, REST OF ASIA-PACIFIC, BY END USER INDUSTRY, VALUE SHARE(%), 2022 VS 2029
- Figure 143:
- ASIA-PACIFIC ENGINEERING PLASTICS MARKET, MOST ACTIVE COMPANIES, BY NUMBER OF STRATEGIC MOVES, 2019 - 2021
- Figure 144:
- ASIA-PACIFIC ENGINEERING PLASTICS MARKET, MOST ADOPTED STRATEGIES, 2019 - 2021
- Figure 145:
- ASIA-PACIFIC ENGINEERING PLASTICS MARKET SHARE(%), BY MAJOR PLAYERS PRODUCTION CAPACITY, 2022
- Figure 146:
- ASIA-PACIFIC FLUOROPOLYMER MARKET SHARE(%), BY MAJOR PLAYERS PRODUCTION CAPACITY, 2022
- Figure 147:
- ASIA-PACIFIC LIQUID CRYSTAL POLYMER (LCP) MARKET SHARE(%), BY MAJOR PLAYERS PRODUCTION CAPACITY, 2022
- Figure 148:
- ASIA-PACIFIC POLYAMIDE (PA) MARKET SHARE(%), BY MAJOR PLAYERS PRODUCTION CAPACITY, 2022
- Figure 149:
- ASIA-PACIFIC POLYBUTYLENE TEREPHTHALATE (PBT) MARKET SHARE(%), BY MAJOR PLAYERS PRODUCTION CAPACITY, 2022
- Figure 150:
- ASIA-PACIFIC POLYCARBONATE (PC) MARKET SHARE(%), BY MAJOR PLAYERS PRODUCTION CAPACITY, 2022
- Figure 151:
- ASIA-PACIFIC POLYETHER ETHER KETONE (PEEK) MARKET SHARE(%), BY MAJOR PLAYERS PRODUCTION CAPACITY, 2022
- Figure 152:
- ASIA-PACIFIC POLYETHYLENE TEREPHTHALATE (PET) MARKET SHARE(%), BY MAJOR PLAYERS PRODUCTION CAPACITY, 2022
- Figure 153:
- ASIA-PACIFIC POLYOXYMETHYLENE (POM) MARKET SHARE(%), BY MAJOR PLAYERS PRODUCTION CAPACITY, 2022
- Figure 154:
- ASIA-PACIFIC STYRENE COPOLYMERS (ABS AND SAN) MARKET SHARE(%), BY MAJOR PLAYERS PRODUCTION CAPACITY, 2022
Asia-pacific Engineering Plastics Industry Segmentation
Aerospace, Automotive, Building and Construction, Electrical and Electronics, Industrial and Machinery, Packaging are covered as segments by End User Industry. Fluoropolymer, Liquid Crystal Polymer (LCP), Polyamide (PA), Polybutylene Terephthalate (PBT), Polycarbonate (PC), Polyether Ether Ketone (PEEK), Polyethylene Terephthalate (PET), Polyimide (PI), Polymethyl Methacrylate (PMMA), Polyoxymethylene (POM), Styrene Copolymers (ABS and SAN) are covered as segments by Resin Type. Australia, China, India, Japan, Malaysia, South Korea are covered as segments by Country.| End User Industry | |
| Aerospace | |
| Automotive | |
| Building and Construction | |
| Electrical and Electronics | |
| Industrial and Machinery | |
| Packaging | |
| Other End-user Industries |
| Resin Type | ||||||||||
| ||||||||||
| Liquid Crystal Polymer (LCP) | ||||||||||
| ||||||||||
| Polybutylene Terephthalate (PBT) | ||||||||||
| Polycarbonate (PC) | ||||||||||
| Polyether Ether Ketone (PEEK) | ||||||||||
| Polyethylene Terephthalate (PET) | ||||||||||
| Polyimide (PI) | ||||||||||
| Polymethyl Methacrylate (PMMA) | ||||||||||
| Polyoxymethylene (POM) | ||||||||||
| Styrene Copolymers (ABS and SAN) |
| Country | |
| Australia | |
| China | |
| India | |
| Japan | |
| Malaysia | |
| South Korea | |
| Rest of Asia-Pacific |
Market Definition
- End-user Industry - Packaging, Electrical & Electronics, Automotive, Building & Construction, and Others are the end-user industries considered under the engineering plastics market.
- Resin - Under the scope of the study, consumption of virgin resins like Fluoropolymer, Polycarbonate, Polyethylene Terephthalate, Polybutylene Terephthalate, Polyoxymethylene, Polymethyl Methacrylate, Styrene Copolymers, Liquid Crystal Polymer, Polyether Ether Ketone, Polyimide, and Polyamide in the primary forms are considered. Recycling has been provided separately under its individual chapter.
Research Methodology
Mordor Intelligence follows a four-step methodology in all our reports.
- Step-1: Identify Key Variables: The quantifiable key variables (industry and extraneous) pertaining to the specific product segment and country are selected from a group of relevant variables & factors based on desk research & literature review; along with primary expert inputs. These variables are further confirmed through regression modeling (wherever required).
- Step-2: Build a Market Model: In order to build a robust forecasting methodology, the variables and factors identified in Step-1 are tested against available historical market numbers. Through an iterative process, the variables required for market forecast are set and the model is built on the basis of these variables.
- Step-3: Validate and Finalize: In this important step, all market numbers, variables and analyst calls are validated through an extensive network of primary research experts from the market studied. The respondents are selected across levels and functions to generate a holistic picture of the market studied.
- Step-4: Research Outputs: Syndicated Reports, Custom Consulting Assignments, Databases & Subscription Platforms