Europe E-bike Market Size

| Icons | Lable | Value |
|---|---|---|
|
|
Study Period | 2017 - 2029 |
|
|
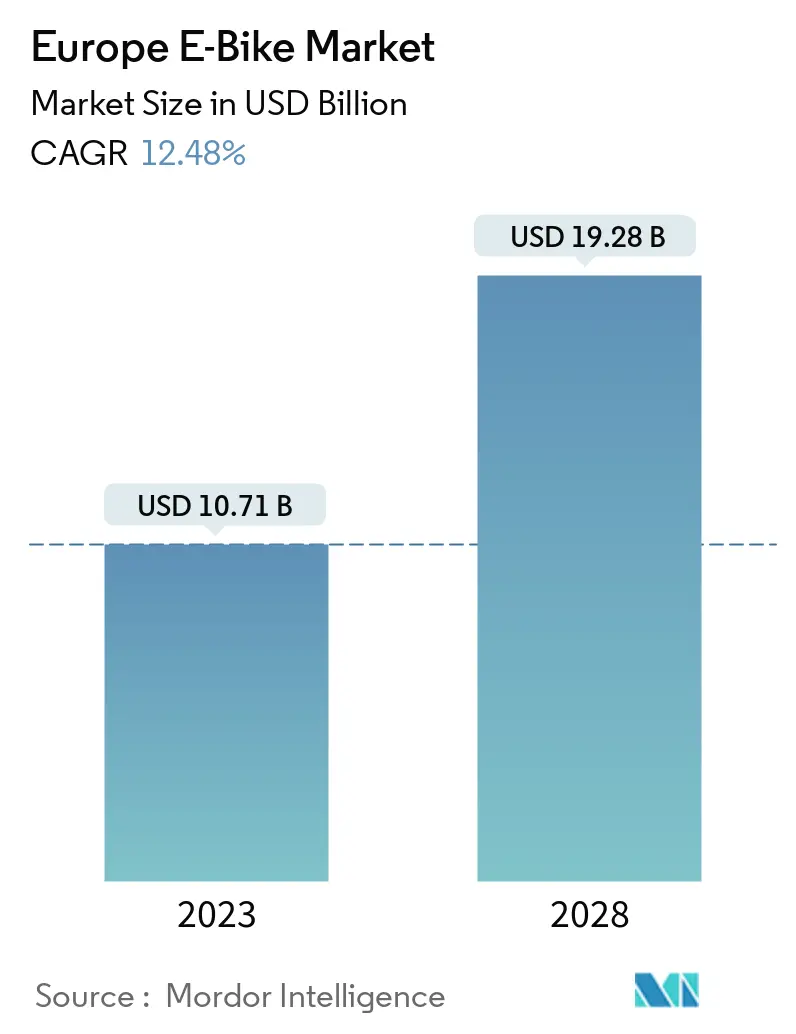
Market Size (2023) | USD 10.71 Billion |
|
|
Market Size (2028) | USD 19.28 Billion |
|
|
CAGR (2023 - 2028) | 12.48 % |
|
|
Largest Share by Propulsion Type | Pedal Assisted |
|
|
Largest Share by Country | Germany |
Major Players |
||
|
|
||
|
*Disclaimer: Major Players sorted in no particular order |
Europe E-bike Market Analysis
The Europe E-Bike Market size is expected to grow from USD 10.71 billion in 2023 to USD 19.28 billion by 2028, at a CAGR of 12.48% during the forecast period (2023-2028).
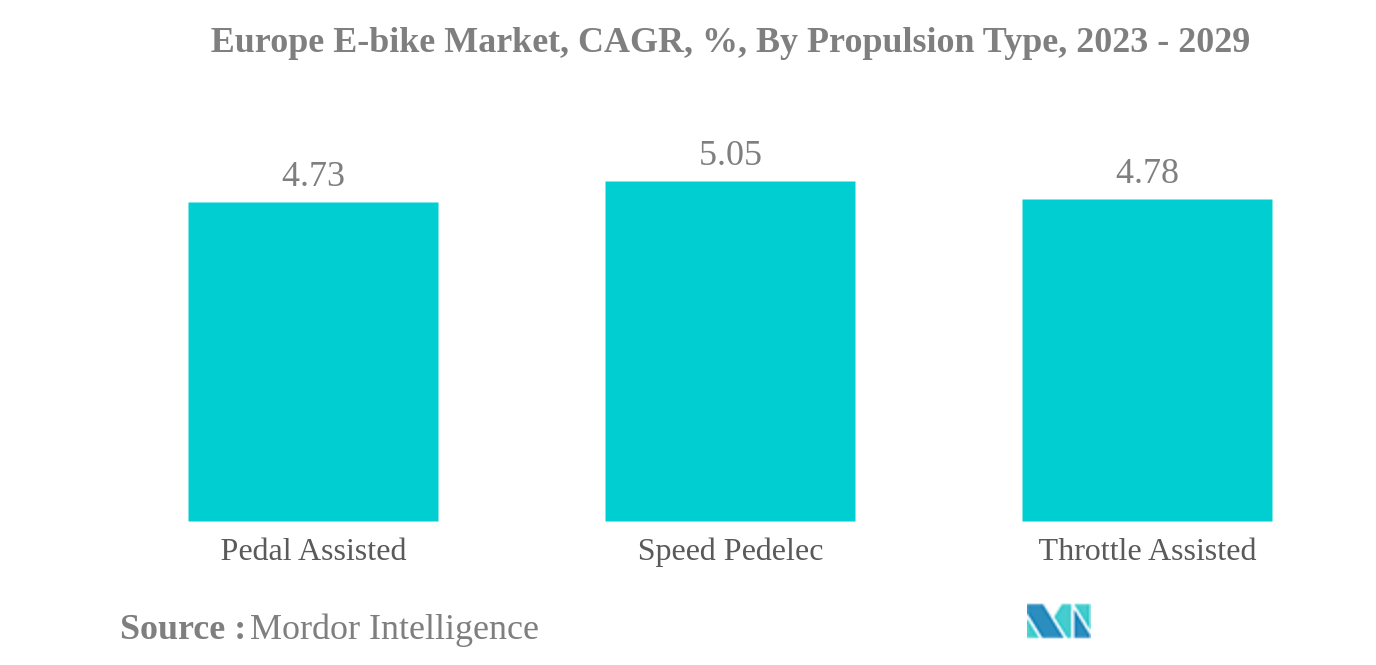
- Largest Segment by Propulsion Type - Pedal Assisted : Countries such as Germany and France are using pedal-assisted bikes extensively due to factors like time-saving, cost benefits, and easy rides, making pedal assisted the largest segment.
- Largest Segment by Application Type - City/Urban : Europe has dedicated bike lanes in cities and suburbs. Courier services are deploying e-bikes to deliver parcels and people are using bikes for daily commutes, thus aiding the growth of the city/urban segment.
- Largest Segment by Battery Type - Lithium-ion Battery : Long-range offerings, less charging time, durability, high power in small sizes, and lightweight are some of the factors that are increasing the usage of lithium batteries, further making Li-ion the largest battery type.
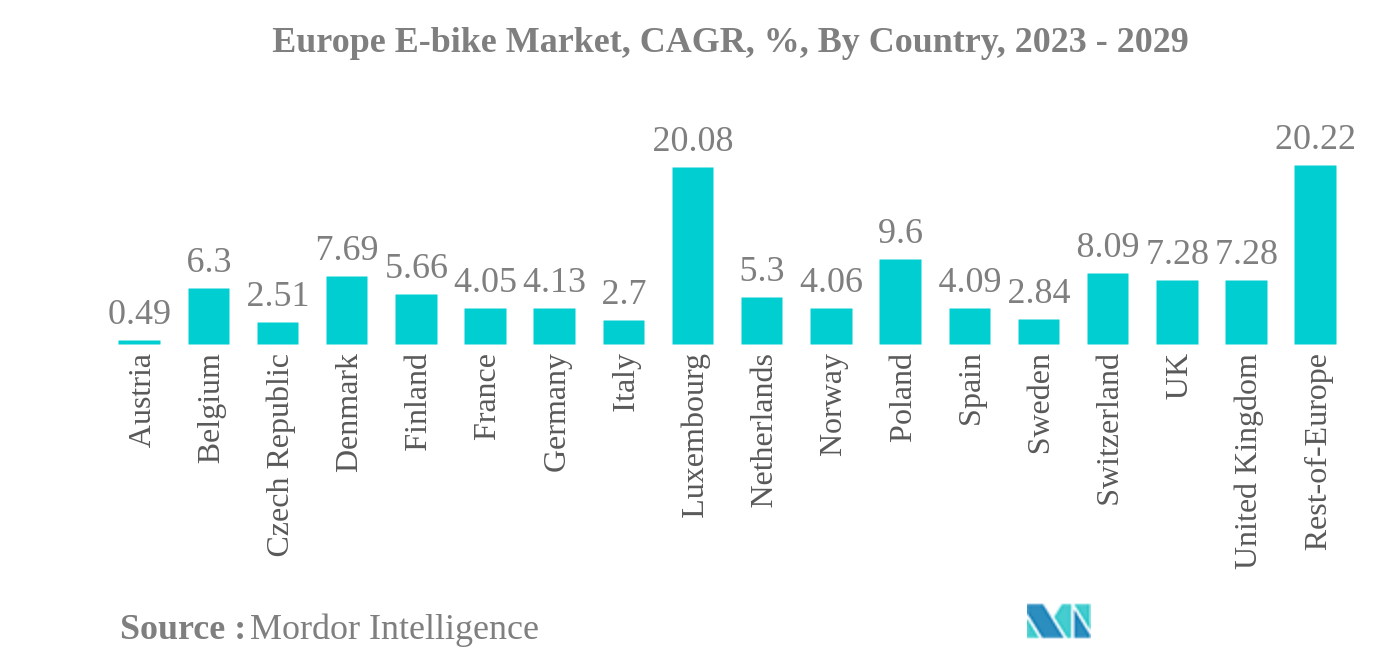
- Largest Country - Germany : Germany has the highest number of e-bikes due to the increase in the electrification of vehicles, stringent norms by the government, and the growing interest of consumers for cleaner rides.
Europe E-bike Market Trends
This section covers the major market trends shaping the Europe E-Bike Market according to our research experts:
Pedal Assisted is the largest segment by Propulsion Type.
- In 2022, the region saw a total of approximately 26 million units of electric bicycles sold, an increase from the 24 million units of bikes sold in 2021. E-city/urban, e-trekking, and e-MTB bikes were the most popular types of electric bikes, accounting for almost 94% of all e-bike sales in the country. The market's growth can be attributed to the innovative nature of the product, the incorporation of fully integrated batteries and drives, attractive designs, and the use of high-quality materials.
- After Germany, the Netherlands is the second-largest e-bike market in Europe. In 2022, the country saw a sale of almost 0.55 million e-bikes, which was a slight increase compared to the previous year, which recorded nearly 0.5 million unit sales. Although there was an increase in the volume of e-bikes in the country compared to the previous year, the change was not significant. This can be attributed to the fact that new bike sales were affected by practices such as bike-sharing systems and swap bikes.
- Some of the major reasons that European countries are adopting e-bikes include the health benefits, environmental benefits, cost savings, the ability to avoid traffic congestion, and increasing demand for e-bikes as sports equipment among young people. These factors are expected to contribute to the market's growth over the forecast period.
Germany is the largest segment by Country.
- Bicycle tourism is popular in countries such as Switzerland and Norway, as they offer attractive spots to be explored on bikes. These countries have rich forests, lakes, rivers, waterfalls, and wildlife, making them popular tourist attractions. A wide network of bike paths, less traffic, and well-maintained roads make these countries safer for cycling enthusiasts.
- Germany leads the electric bicycle industry in Europe. According to the Federal Statistical Office, 7.1 million e-bikes were owned by German households at the start of 2021, up from 5.9 million in 2020. One in every eight German families, or 5.1 million people, owned an e-bike, up from 4.3 million the previous year. According to the cycling industry group ZIV, in 2020, the average price of an e-bike in the country was EUR 1,279, higher than the previous years. According to the organization, despite raw material shortages and supply-chain disruptions due to the pandemic, e-bike sales increased by 9.1% in the first half of 2021. The German bicycle industry also performed well on the export market, with an increase to 730,000 units, i.e., 11%, and of these, 248,200 were e-bikes.
- Significant factors that are projected to boost the expansion of the European e-bike market include government financing and strict restrictions. As more people are becoming interested in using e-bikes as a reliable, safe, and eco-friendly mode of transport, the e-bike market in Europe is expected to grow further during the forecast period.
Europe E-bike Industry Overview
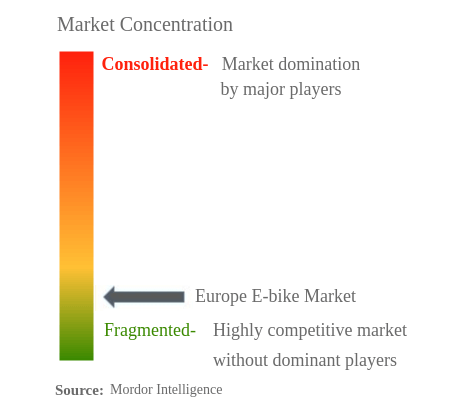
The Europe E-bike Market is fragmented, with the top five companies occupying 11.90%. The major players in this market are Giant Manufacturing Co. Ltd., Kalkhoff Werke GmbH, Riese & Müller, Trek Bicycle Corporation and Yamaha Bicycles (sorted alphabetically).
Europe E-bike Market Leaders
Giant Manufacturing Co. Ltd.
Kalkhoff Werke GmbH
Riese & Müller
Trek Bicycle Corporation
Yamaha Bicycles
*Disclaimer: Major Players sorted in no particular order
Europe E-bike Market News
- December 2022: Volt Bikes and City AM collaborate for the Launch of an ESG-Focused Project. Impact AM is a brand-new division of City AM that specializes in environmental, social, and governance issues.
- November 2022: The Stormguard E+, a full-suspension e-bike, is unveiled by Giant. The bicycles will be available for purchase in Europe in 2023 and will cost 7,999 Euros for the E+1 and 6,499 Euros for the E+2.
- August 2022: The S3 Aluminum, a streamlined, high-end e-bike from VanMoof, has been released. Raw welding and a brushed metal frame are all that remains of the S3 Aluminum.
Europe E-bike Market Report - Table of Contents
EXECUTIVE SUMMARY & KEY FINDINGS
REPORT OFFERS
1. INTRODUCTION
1.1. Study Assumptions & Market Definition
1.2. Scope of the Study
1.3. Research Methodology
2. KEY INDUSTRY TRENDS
2.1. Bicycle Sales
2.2. GDP Per Capita
2.3. Inflation Rate
2.4. Adoption Rate Of E-Bikes
2.5. Percent Population/Commuters With 5-15 Km Daily Travel Distance
2.6. Bicycle Rental
2.7. E-Bike Battery Price
2.8. Price Chart Of Different Battery Chemistry
2.9. Hyper-Local Delivery
2.10. Dedicated Bicycle Lanes
2.11. Number Of Trekkers
2.12. Battery Charging Capacity
2.13. Traffic Congestion Index
2.14. Regulatory Framework
2.15. Value Chain & Distribution Channel Analysis
3. MARKET SEGMENTATION
3.1. Propulsion Type
3.1.1. Pedal Assisted
3.1.2. Speed Pedelec
3.1.3. Throttle Assisted
3.2. Application Type
3.2.1. Cargo/Utility
3.2.2. City/Urban
3.2.3. Trekking
3.3. Battery Type
3.3.1. Lead Acid Battery
3.3.2. Lithium-ion Battery
3.3.3. Others
3.4. Country
3.4.1. Austria
3.4.2. Belgium
3.4.3. Czech Republic
3.4.4. Denmark
3.4.5. Finland
3.4.6. France
3.4.7. Germany
3.4.8. Italy
3.4.9. Luxembourg
3.4.10. Netherlands
3.4.11. Norway
3.4.12. Poland
3.4.13. Spain
3.4.14. Sweden
3.4.15. Switzerland
3.4.16. UK
3.4.17. Rest-of-Europe
4. COMPETITIVE LANDSCAPE
4.1. Key Strategic Moves
4.2. Market Share Analysis
4.3. Company Landscape
4.4. Company Profiles
4.4.1. Accell Group N.V.
4.4.2. Brompton Bicycle
4.4.3. Fritzmeier Systems GmbH & Co. KG (M1 Sporttechnik)
4.4.4. Giant Manufacturing Co. Ltd.
4.4.5. Kalkhoff Werke GmbH
4.4.6. KTM Bike Industries
4.4.7. Merida Industry Co. Ltd
4.4.8. Pedego Electric Bikes
4.4.9. Riese & Müller
4.4.10. Royal Dutch Gazelle
4.4.11. Swiss E-Mobility Group (SEMG)
4.4.12. Trek Bicycle Corporation
4.4.13. VanMoof BV
4.4.14. Volt Electric Bikes
4.4.15. Yamaha Bicycles
5. KEY STRATEGIC QUESTIONS FOR E BIKES CEOS
6. APPENDIX
6.1. Global Overview
6.1.1. Overview
6.1.2. Porter’s Five Forces Framework
6.1.3. Global Value Chain Analysis
6.1.4. Market Dynamics (DROs)
6.2. Sources & References
6.3. List of Tables & Figures
6.4. Primary Insights
6.5. Data Pack
6.6. Glossary of Terms
List of Tables & Figures
- Figure 1:
- EUROPE E-BIKE MARKET, BICYCLE SALES, VOLUME, THOUSAND UNITS, 2017 - 2029
- Figure 2:
- EUROPE E-BIKE MARKET, GDP PER CAPITA, VALUE, USD, 2017 - 2029
- Figure 3:
- EUROPE E-BIKE MARKET, INFLATION RATE, VALUE, PERCENT, 2017 - 2029
- Figure 4:
- EUROPE E-BIKE MARKET, ADOPTION RATE, VOLUME, PERCENT, 2017 - 2029
- Figure 5:
- EUROPE E-BIKE MARKET, COMMUTERS WITH 5-15 KM TRAVEL DISTANCE, VOLUME, PERCENT, 2017 - 2029
- Figure 6:
- EUROPE E-BIKE MARKET, BICYCLE RENTAL, VALUE, USD MILLION, 2017 - 2029
- Figure 7:
- EUROPE E-BIKE MARKET, E-BIKE BATTERY PRICE, VALUE, USD, 2017 - 2029
- Figure 8:
- EUROPE E-BIKE MARKET, PRICE CHART OF DIFFERENT BATTERY CHEMISTRY, VALUE, USD, 2017 - 2029
- Figure 9:
- EUROPE E-BIKE MARKET, HYPER-LOCAL DELIVERY, VOLUME, THOUSAND UNITS, 2017 - 2029
- Figure 10:
- EUROPE E-BIKE MARKET, DEDICATED BICYCLE LANES, VOLUME, THOUSAND UNITS, 2017 - 2029
- Figure 11:
- EUROPE E-BIKE MARKET, NUMBER OF TREKKERS, VOLUME, THOUSAND UNITS, 2017 - 2029
- Figure 12:
- EUROPE E-BIKE MARKET, BATTERY CHARGING CAPACITY, VOLUME, UNITS, 2017 - 2029
- Figure 13:
- EUROPE E-BIKE MARKET, TRAFFIC CONGESTION INDEX, VOLUME, PERCENT, 2017 - 2022
- Figure 14:
- EUROPE E-BIKE MARKET, VOLUME, UNITS, 2017 - 2029
- Figure 15:
- EUROPE E-BIKE MARKET, VALUE, USD MILLION, 2017 - 2029
- Figure 16:
- EUROPE E-BIKE MARKET, BY PROPULSION TYPE, VOLUME, UNITS, 2017 - 2029
- Figure 17:
- EUROPE E-BIKE MARKET, BY PROPULSION TYPE, VALUE, USD MILLION, 2017 - 2029
- Figure 18:
- EUROPE E-BIKE MARKET, BY PROPULSION TYPE, VOLUME, SHARE (%), 2017 - 2029
- Figure 19:
- EUROPE E-BIKE MARKET, BY PROPULSION TYPE, VALUE, SHARE (%), 2017 - 2029
- Figure 20:
- EUROPE E-BIKE MARKET, BY PROPULSION TYPE, VOLUME, UNITS, 2017 - 2029
- Figure 21:
- EUROPE E-BIKE MARKET, BY PROPULSION TYPE, VALUE, USD MILLION, 2017 - 2029
- Figure 22:
- EUROPE E-BIKE MARKET, BY PROPULSION TYPE, VALUE SHARE (%), 2022 - 2029
- Figure 23:
- EUROPE E-BIKE MARKET, BY PROPULSION TYPE, VOLUME, UNITS, 2017 - 2029
- Figure 24:
- EUROPE E-BIKE MARKET, BY PROPULSION TYPE, VALUE, USD MILLION, 2017 - 2029
- Figure 25:
- EUROPE E-BIKE MARKET, BY PROPULSION TYPE, VALUE SHARE (%), 2022 - 2029
- Figure 26:
- EUROPE E-BIKE MARKET, BY PROPULSION TYPE, VOLUME, UNITS, 2017 - 2029
- Figure 27:
- EUROPE E-BIKE MARKET, BY PROPULSION TYPE, VALUE, USD MILLION, 2017 - 2029
- Figure 28:
- EUROPE E-BIKE MARKET, BY PROPULSION TYPE, VALUE SHARE (%), 2022 - 2029
- Figure 29:
- EUROPE E-BIKE MARKET, BY APPLICATION TYPE, VOLUME, UNITS, 2017 - 2029
- Figure 30:
- EUROPE E-BIKE MARKET, BY APPLICATION TYPE, VALUE, USD MILLION, 2017 - 2029
- Figure 31:
- EUROPE E-BIKE MARKET, BY APPLICATION TYPE, VOLUME, SHARE (%), 2017 - 2029
- Figure 32:
- EUROPE E-BIKE MARKET, BY APPLICATION TYPE, VALUE, SHARE (%), 2017 - 2029
- Figure 33:
- EUROPE E-BIKE MARKET, BY APPLICATION TYPE, VOLUME, UNITS, 2017 - 2029
- Figure 34:
- EUROPE E-BIKE MARKET, BY APPLICATION TYPE, VALUE, USD MILLION, 2017 - 2029
- Figure 35:
- EUROPE E-BIKE MARKET, BY APPLICATION TYPE, VALUE SHARE (%), 2022 - 2029
- Figure 36:
- EUROPE E-BIKE MARKET, BY APPLICATION TYPE, VOLUME, UNITS, 2017 - 2029
- Figure 37:
- EUROPE E-BIKE MARKET, BY APPLICATION TYPE, VALUE, USD MILLION, 2017 - 2029
- Figure 38:
- EUROPE E-BIKE MARKET, BY APPLICATION TYPE, VALUE SHARE (%), 2022 - 2029
- Figure 39:
- EUROPE E-BIKE MARKET, BY APPLICATION TYPE, VOLUME, UNITS, 2017 - 2029
- Figure 40:
- EUROPE E-BIKE MARKET, BY APPLICATION TYPE, VALUE, USD MILLION, 2017 - 2029
- Figure 41:
- EUROPE E-BIKE MARKET, BY APPLICATION TYPE, VALUE SHARE (%), 2022 - 2029
- Figure 42:
- EUROPE E-BIKE MARKET, BY BATTERY TYPE, VOLUME, UNITS, 2017 - 2029
- Figure 43:
- EUROPE E-BIKE MARKET, BY BATTERY TYPE, VALUE, USD MILLION, 2017 - 2029
- Figure 44:
- EUROPE E-BIKE MARKET, BY BATTERY TYPE, VOLUME, SHARE (%), 2017 - 2029
- Figure 45:
- EUROPE E-BIKE MARKET, BY BATTERY TYPE, VALUE, SHARE (%), 2017 - 2029
- Figure 46:
- EUROPE E-BIKE MARKET, BY BATTERY TYPE, VOLUME, UNITS, 2017 - 2029
- Figure 47:
- EUROPE E-BIKE MARKET, BY BATTERY TYPE, VALUE, USD MILLION, 2017 - 2029
- Figure 48:
- EUROPE E-BIKE MARKET, BY BATTERY TYPE, VALUE SHARE (%), 2022 - 2029
- Figure 49:
- EUROPE E-BIKE MARKET, BY BATTERY TYPE, VOLUME, UNITS, 2017 - 2029
- Figure 50:
- EUROPE E-BIKE MARKET, BY BATTERY TYPE, VALUE, USD MILLION, 2017 - 2029
- Figure 51:
- EUROPE E-BIKE MARKET, BY BATTERY TYPE, VALUE SHARE (%), 2022 - 2029
- Figure 52:
- EUROPE E-BIKE MARKET, BY BATTERY TYPE, VOLUME, UNITS, 2017 - 2029
- Figure 53:
- EUROPE E-BIKE MARKET, BY BATTERY TYPE, VALUE, USD MILLION, 2017 - 2029
- Figure 54:
- EUROPE E-BIKE MARKET, BY BATTERY TYPE, VALUE SHARE (%), 2022 - 2029
- Figure 55:
- EUROPE E-BIKE MARKET, ALL , VOLUME, UNITS, 2017 - 2029
- Figure 56:
- EUROPE E-BIKE MARKET, ALL , VALUE, USD MILLION, 2017 - 2029
- Figure 57:
- EUROPE E-BIKE MARKET, ALL , VOLUME, SHARE (%), 2017 - 2029
- Figure 58:
- EUROPE E-BIKE MARKET, ALL , VALUE, SHARE (%), 2017 - 2029
- Figure 59:
- EUROPE E-BIKE MARKET, AUSTRIA , VOLUME, UNITS, 2017 - 2029
- Figure 60:
- EUROPE E-BIKE MARKET, AUSTRIA , VALUE, USD MILLION, 2017 - 2029
- Figure 61:
- EUROPE E-BIKE MARKET, AUSTRIA , VALUE SHARE (%), 2022 - 2029
- Figure 62:
- EUROPE E-BIKE MARKET, BELGIUM , VOLUME, UNITS, 2017 - 2029
- Figure 63:
- EUROPE E-BIKE MARKET, BELGIUM , VALUE, USD MILLION, 2017 - 2029
- Figure 64:
- EUROPE E-BIKE MARKET, BELGIUM , VALUE SHARE (%), 2022 - 2029
- Figure 65:
- EUROPE E-BIKE MARKET, CZECH REPUBLIC , VOLUME, UNITS, 2017 - 2029
- Figure 66:
- EUROPE E-BIKE MARKET, CZECH REPUBLIC , VALUE, USD MILLION, 2017 - 2029
- Figure 67:
- EUROPE E-BIKE MARKET, CZECH REPUBLIC , VALUE SHARE (%), 2022 - 2029
- Figure 68:
- EUROPE E-BIKE MARKET, DENMARK , VOLUME, UNITS, 2017 - 2029
- Figure 69:
- EUROPE E-BIKE MARKET, DENMARK , VALUE, USD MILLION, 2017 - 2029
- Figure 70:
- EUROPE E-BIKE MARKET, DENMARK , VALUE SHARE (%), 2022 - 2029
- Figure 71:
- EUROPE E-BIKE MARKET, FINLAND , VOLUME, UNITS, 2017 - 2029
- Figure 72:
- EUROPE E-BIKE MARKET, FINLAND , VALUE, USD MILLION, 2017 - 2029
- Figure 73:
- EUROPE E-BIKE MARKET, FINLAND , VALUE SHARE (%), 2022 - 2029
- Figure 74:
- EUROPE E-BIKE MARKET, FRANCE , VOLUME, UNITS, 2017 - 2029
- Figure 75:
- EUROPE E-BIKE MARKET, FRANCE , VALUE, USD MILLION, 2017 - 2029
- Figure 76:
- EUROPE E-BIKE MARKET, FRANCE , VALUE SHARE (%), 2022 - 2029
- Figure 77:
- EUROPE E-BIKE MARKET, GERMANY , VOLUME, UNITS, 2017 - 2029
- Figure 78:
- EUROPE E-BIKE MARKET, GERMANY , VALUE, USD MILLION, 2017 - 2029
- Figure 79:
- EUROPE E-BIKE MARKET, GERMANY , VALUE SHARE (%), 2022 - 2029
- Figure 80:
- EUROPE E-BIKE MARKET, ITALY , VOLUME, UNITS, 2017 - 2029
- Figure 81:
- EUROPE E-BIKE MARKET, ITALY , VALUE, USD MILLION, 2017 - 2029
- Figure 82:
- EUROPE E-BIKE MARKET, ITALY , VALUE SHARE (%), 2022 - 2029
- Figure 83:
- EUROPE E-BIKE MARKET, LUXEMBOURG , VOLUME, UNITS, 2017 - 2029
- Figure 84:
- EUROPE E-BIKE MARKET, LUXEMBOURG , VALUE, USD MILLION, 2017 - 2029
- Figure 85:
- EUROPE E-BIKE MARKET, LUXEMBOURG , VALUE SHARE (%), 2022 - 2029
- Figure 86:
- EUROPE E-BIKE MARKET, NETHERLANDS , VOLUME, UNITS, 2017 - 2029
- Figure 87:
- EUROPE E-BIKE MARKET, NETHERLANDS , VALUE, USD MILLION, 2017 - 2029
- Figure 88:
- EUROPE E-BIKE MARKET, NETHERLANDS , VALUE SHARE (%), 2022 - 2029
- Figure 89:
- EUROPE E-BIKE MARKET, NORWAY , VOLUME, UNITS, 2017 - 2029
- Figure 90:
- EUROPE E-BIKE MARKET, NORWAY , VALUE, USD MILLION, 2017 - 2029
- Figure 91:
- EUROPE E-BIKE MARKET, NORWAY , VALUE SHARE (%), 2022 - 2029
- Figure 92:
- EUROPE E-BIKE MARKET, POLAND , VOLUME, UNITS, 2017 - 2029
- Figure 93:
- EUROPE E-BIKE MARKET, POLAND , VALUE, USD MILLION, 2017 - 2029
- Figure 94:
- EUROPE E-BIKE MARKET, POLAND , VALUE SHARE (%), 2022 - 2029
- Figure 95:
- EUROPE E-BIKE MARKET, SPAIN , VOLUME, UNITS, 2017 - 2029
- Figure 96:
- EUROPE E-BIKE MARKET, SPAIN , VALUE, USD MILLION, 2017 - 2029
- Figure 97:
- EUROPE E-BIKE MARKET, SPAIN , VALUE SHARE (%), 2022 - 2029
- Figure 98:
- EUROPE E-BIKE MARKET, SWEDEN , VOLUME, UNITS, 2017 - 2029
- Figure 99:
- EUROPE E-BIKE MARKET, SWEDEN , VALUE, USD MILLION, 2017 - 2029
- Figure 100:
- EUROPE E-BIKE MARKET, SWEDEN , VALUE SHARE (%), 2022 - 2029
- Figure 101:
- EUROPE E-BIKE MARKET, SWITZERLAND , VOLUME, UNITS, 2017 - 2029
- Figure 102:
- EUROPE E-BIKE MARKET, SWITZERLAND , VALUE, USD MILLION, 2017 - 2029
- Figure 103:
- EUROPE E-BIKE MARKET, SWITZERLAND , VALUE SHARE (%), 2022 - 2029
- Figure 104:
- EUROPE E-BIKE MARKET, UK , VOLUME, UNITS, 2017 - 2029
- Figure 105:
- EUROPE E-BIKE MARKET, UK , VALUE, USD MILLION, 2017 - 2029
- Figure 106:
- EUROPE E-BIKE MARKET, UK , VALUE SHARE (%), 2022 - 2029
- Figure 107:
- EUROPE E-BIKE MARKET, REST-OF-EUROPE , VOLUME, UNITS, 2017 - 2029
- Figure 108:
- EUROPE E-BIKE MARKET, REST-OF-EUROPE , VALUE, USD MILLION, 2017 - 2029
- Figure 109:
- EUROPE E-BIKE MARKET, REST-OF-EUROPE , VALUE SHARE (%), 2022 - 2029
- Figure 110:
- EUROPE E-BIKE MARKET, MOST ACTIVE COMPANIES, BY NUMBER OF STRATEGIC MOVES, 2018 - 2021
- Figure 111:
- EUROPE E-BIKE MARKET, MOST ADOPTED STRATEGIES, 2018 - 2021
- Figure 112:
- EUROPE E-BIKE MARKET SHARE(%), BY MAJOR PLAYERS, 2022
Europe E-bike Industry Segmentation
Pedal Assisted, Speed Pedelec, Throttle Assisted are covered as segments by Propulsion Type. Cargo/Utility, City/Urban, Trekking are covered as segments by Application Type. Lead Acid Battery, Lithium-ion Battery, Others are covered as segments by Battery Type. Austria, Belgium, Czech Republic, Denmark, Finland, France, Germany, Italy, Luxembourg, Netherlands, Norway, Poland, Spain, Sweden, Switzerland, UK, Rest-of-Europe are covered as segments by Country.| Propulsion Type | |
| Pedal Assisted | |
| Speed Pedelec | |
| Throttle Assisted |
| Application Type | |
| Cargo/Utility | |
| City/Urban | |
| Trekking |
| Battery Type | |
| Lead Acid Battery | |
| Lithium-ion Battery | |
| Others |
| Country | |
| Austria | |
| Belgium | |
| Czech Republic | |
| Denmark | |
| Finland | |
| France | |
| Germany | |
| Italy | |
| Luxembourg | |
| Netherlands | |
| Norway | |
| Poland | |
| Spain | |
| Sweden | |
| Switzerland | |
| UK | |
| Rest-of-Europe |
Market Definition
- By Application Type - E-bikes considered under this segment include city/urban, trekking, and cargo/utility e-bikes. The common types of e-bikes under these three categories include off-road/hybrid, kids, ladies/gents, cross, MTB, folding, fat tire, and sports e-bike.
- By Battery Type - This segment includes lithium-ion batteries, lead-acid batteries, and other battery types. The other battery type category includes nickel-metal hydroxide (NiMH), silicon, and lithium-polymer batteries.
- By Propulsion Type - E-bikes considered under this segment include pedal-assisted e-bikes, throttle-assisted e-bikes, and speed pedelec. While the speed limit of pedal and throttle-assisted e-bikes is usually 25 km/h, the speed limit of speed pedelec is generally 45 km/h (28 mph).
Research Methodology
Mordor Intelligence follows a four-step methodology in all our reports.
- Step-1: Identify Key Variables: In order to build a robust forecasting methodology, the variables and factors identified in Step-1 are tested against available historical market numbers. Through an iterative process, the variables required for market forecast are set and the model is built on the basis of these variables.
- Step-2: Build a Market Model: Market-size estimations for the historical and forecast years have been provided in revenue and volume terms. For sales conversion to volume, the average selling price (ASP) is kept constant throughout the forecast period for each country, and inflation is not a part of the pricing.
- Step-3: Validate and Finalize: In this important step, all market numbers, variables and analyst calls are validated through an extensive network of primary research experts from the market studied. The respondents are selected across levels and functions to generate a holistic picture of the market studied.
- Step-4: Research Outputs: Syndicated Reports, Custom Consulting Assignments, Databases & Subscription Platforms