China Biofertilizer Market Size

| Icons | Lable | Value |
|---|---|---|
|
|
Study Period | 2017 - 2029 |
|
|
Base Year For Estimation | 2022 |
|
|
CAGR | 10.17 % |
|
|
Largest Share by Form | Azotobacter |
|
|
Fastest Growing by Form | Rhizobium |
|
|
Market Concentration | High |
Major Players |
||
|
|
||
|
*Disclaimer: Major Players sorted in no particular order |
China Biofertilizer Market Analysis
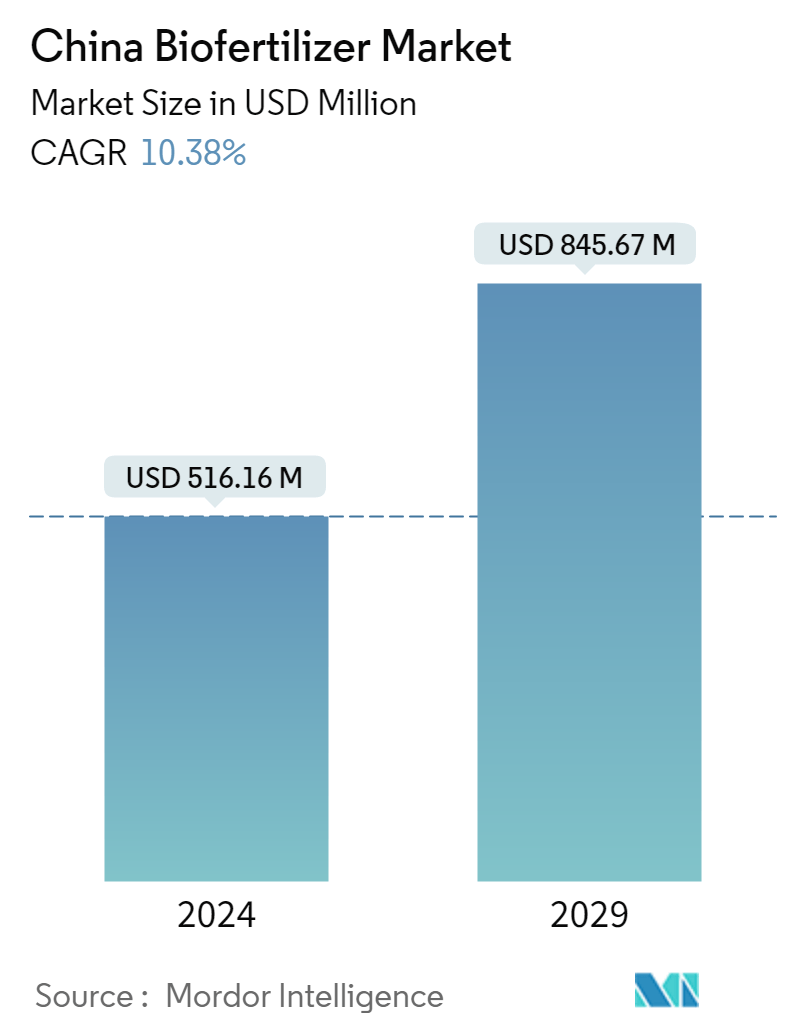
The China Biofertilizer Market is projected to register a CAGR of 10.17%
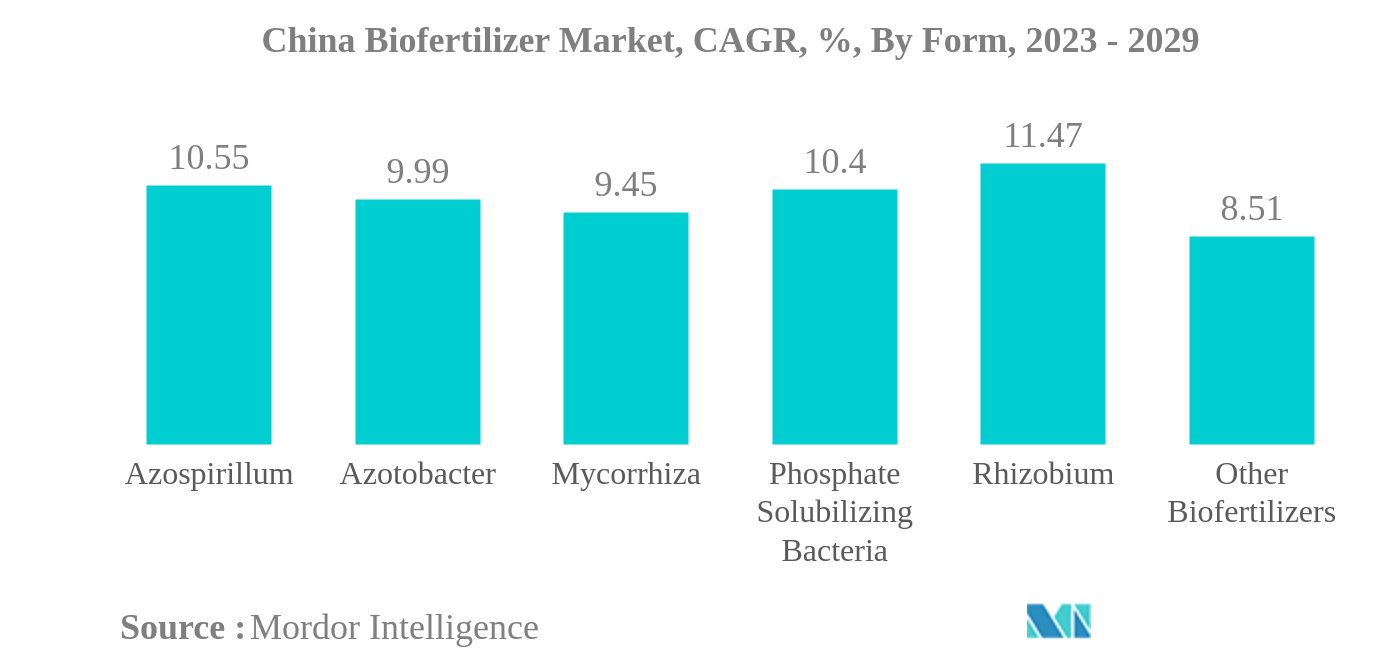
- Azotobacter is the Largest Form : Azotobacter is a nitrogen-fixing bacteria that capable of fixing roughly 20.0 kg of nitrogen per hectare and can be used as a substitute for mineral nitrogen fertilizers.
- Rhizobium is the Fastest-growing Form : Rhizobium, a member of the bacterial family Rhizobiaceae, can fix N2 in both legumes and non-legume crops and capable of fixing up to 300 kg N/ha/year in various legume crops.
- Row Crops is the Largest Crop Type : The major row crops grown in China are rice, wheat, corn, peanuts, millet, barley, oilseeds. Azotobacter is the most consumed biofertilizer in row crops with 31.7% in 2022.
- Cash Crops is the Fastest-growing Crop Type : The major cash crops grown in China include sugarcane, tea, cotton, tobacco, etc. Seaweed extracts are the most consumed biofertilizer in cash crops with 29.6% in 2022.
China Biofertilizer Market Trends
This section covers the major market trends shaping the China Biofertilizer Market according to our research experts:
Azotobacter is the largest Form
- Biofertilizers are living microorganisms that improve plant nutrition by mobilizing or increasing nutrient availability in soils. Biofertilizers are essential components of organic farming that play an important role in long-term soil fertility and sustainability by fixing atmospheric nitrogen, mobilizing fixed macro and micronutrients, or converting insoluble phosphorous in the soil into forms available to plants.
- In the Chinese biofertilizer market, Azotobacter is the most consumed biofertilizer, dominating the market with a share of 31.3%, valued at USD 137.1 million, followed by Mycorrhiza, Azospirillum, Rhizobium, and phosphate-solubilizing bacteria with shares of 22%, 22.0%, 11.6%, and 11.2%, respectively, in 2022.
- As of 2021, China achieved its "eighteenth consecutive bumper grain harvest." However, this achievement was accomplished by problems such as the chronic overuse of agricultural fertilizers. China exceeds the internationally accepted upper limit of agricultural fertilizer per unit area. As a major global agricultural producer, China proposed a fertilizer reduction and efficiency initiative in 2015 to achieve "zero fertilizer growth rate and zero fertilizer use reduction" by 2020. China achieved a fertilizer reduction of 12.82% from 2015 to 2020. This initiative increased the consumption value of biofertilizers in the Chinese agricultural sector by 7.0% during the historical period (2017-2022).
- Organic farming is also increasing in China as the demand for organic food continues to rise. From 2017 to 2022, 29.6% of organic acreage increased. Increasing organic acreage and government initiatives are expected to boost the value of the Chinese biofertilizers market during the forecast period by 78.8%.
China Biofertilizer Industry Overview
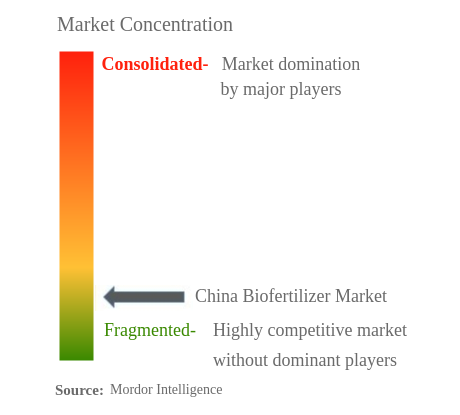
The China Biofertilizer Market is fragmented, with the top five companies occupying 3.08%. The major players in this market are Biolchim SpA, Genliduo Bio-tech Corporation Ltd, Kiwa Bio-Tech, Novozymes and Shandong Sukahan Bio-Technology Co. Ltd (sorted alphabetically).
China Biofertilizer Market Leaders
Biolchim SpA
Genliduo Bio-tech Corporation Ltd
Kiwa Bio-Tech
Novozymes
Shandong Sukahan Bio-Technology Co. Ltd
*Disclaimer: Major Players sorted in no particular order
China Biofertilizer Market News
- September 2022: Corteva Agriscience agreed to acquire Symborg Inc. to strengthen its global presence with a strong distribution network.
- January 2021: Atlántica Agrícola developed Micomix, a biostimulant composed primarily of mycorrhizal fungi, rhizobacteria, and chelated micronutrients. The presence and development of these microorganisms in the rhizosphere create a symbiotic relationship with the plant that favors the absorption of water and mineral nutrients and increases its tolerance to water and salt stress.
China Biofertilizer Market Report - Table of Contents
EXECUTIVE SUMMARY & KEY FINDINGS
REPORT OFFERS
1. INTRODUCTION
1.1. Study Assumptions & Market Definition
1.2. Scope of the Study
1.3. Research Methodology
2. KEY INDUSTRY TRENDS
2.1. Area Under Organic Cultivation
2.2. Per Capita Spending On Organic Products
2.3. Regulatory Framework
2.4. Value Chain & Distribution Channel Analysis
3. MARKET SEGMENTATION
3.1. Form
3.1.1. Azospirillum
3.1.2. Azotobacter
3.1.3. Mycorrhiza
3.1.4. Phosphate Solubilizing Bacteria
3.1.5. Rhizobium
3.1.6. Other Biofertilizers
3.2. Crop Type
3.2.1. Cash Crops
3.2.2. Horticultural Crops
3.2.3. Row Crops
4. COMPETITIVE LANDSCAPE
4.1. Key Strategic Moves
4.2. Market Share Analysis
4.3. Company Landscape
4.4. Company Profiles
4.4.1. Atlántica Agrícola
4.4.2. Binzhou Jingyang Biological Fertilizer Co. Ltd
4.4.3. Biolchim SpA
4.4.4. Dora Agri-Tech
4.4.5. Genliduo Bio-tech Corporation Ltd
4.4.6. Kiwa Bio-Tech
4.4.7. Novozymes
4.4.8. Shandong Sukahan Bio-Technology Co. Ltd
4.4.9. Suståne Natural Fertilizer Inc.
4.4.10. Symborg Inc.
5. KEY STRATEGIC QUESTIONS FOR AGRICULTURAL BIOLOGICALS CEOS
6. APPENDIX
6.1. Global Overview
6.1.1. Overview
6.1.2. Porter’s Five Forces Framework
6.1.3. Global Value Chain Analysis
6.1.4. Market Dynamics (DROs)
6.2. Sources & References
6.3. List of Tables & Figures
6.4. Primary Insights
6.5. Data Pack
6.6. Glossary of Terms
List of Tables & Figures
- Figure 1:
- CHINA BIOFERTILIZER MARKET, AREA UNDER ORGANIC CULTIVATION, HECTARES, 2017 - 2022
- Figure 2:
- CHINA BIOFERTILIZER MARKET, PER CAPITA SPENDING ON ORGANIC PRODUCTS, USD, 2017 - 2022
- Figure 3:
- CHINA BIOFERTILIZER MARKET, VOLUME, METRIC TON, 2017 - 2029
- Figure 4:
- CHINA BIOFERTILIZER MARKET, VALUE, USD, 2017 - 2029
- Figure 5:
- CHINA BIOFERTILIZER MARKET, BY FORM, VOLUME, METRIC TON, 2017 - 2029
- Figure 6:
- CHINA BIOFERTILIZER MARKET, BY FORM, VALUE, USD, 2017 - 2029
- Figure 7:
- CHINA BIOFERTILIZER MARKET, VOLUME SHARE(%), BY FORM, 2017 - 2029
- Figure 8:
- CHINA BIOFERTILIZER MARKET, VALUE SHARE(%), BY FORM, 2017 - 2029
- Figure 9:
- CHINA BIOFERTILIZER MARKET, BY FORM, VOLUME, METRIC TON, 2017 - 2029
- Figure 10:
- CHINA BIOFERTILIZER MARKET, BY FORM, VALUE, USD, 2017 - 2029
- Figure 11:
- CHINA BIOFERTILIZER MARKET, VALUE SHARE(%), BY CROP TYPE, 2022 - 2029
- Figure 12:
- CHINA BIOFERTILIZER MARKET, BY FORM, VOLUME, METRIC TON, 2017 - 2029
- Figure 13:
- CHINA BIOFERTILIZER MARKET, BY FORM, VALUE, USD, 2017 - 2029
- Figure 14:
- CHINA BIOFERTILIZER MARKET, VALUE SHARE(%), BY CROP TYPE, 2022 - 2029
- Figure 15:
- CHINA BIOFERTILIZER MARKET, BY FORM, VOLUME, METRIC TON, 2017 - 2029
- Figure 16:
- CHINA BIOFERTILIZER MARKET, BY FORM, VALUE, USD, 2017 - 2029
- Figure 17:
- CHINA BIOFERTILIZER MARKET, VALUE SHARE(%), BY CROP TYPE, 2022 - 2029
- Figure 18:
- CHINA BIOFERTILIZER MARKET, BY FORM, VOLUME, METRIC TON, 2017 - 2029
- Figure 19:
- CHINA BIOFERTILIZER MARKET, BY FORM, VALUE, USD, 2017 - 2029
- Figure 20:
- CHINA BIOFERTILIZER MARKET, VALUE SHARE(%), BY CROP TYPE, 2022 - 2029
- Figure 21:
- CHINA BIOFERTILIZER MARKET, BY FORM, VOLUME, METRIC TON, 2017 - 2029
- Figure 22:
- CHINA BIOFERTILIZER MARKET, BY FORM, VALUE, USD, 2017 - 2029
- Figure 23:
- CHINA BIOFERTILIZER MARKET, VALUE SHARE(%), BY CROP TYPE, 2022 - 2029
- Figure 24:
- CHINA BIOFERTILIZER MARKET, BY FORM, VOLUME, METRIC TON, 2017 - 2029
- Figure 25:
- CHINA BIOFERTILIZER MARKET, BY FORM, VALUE, USD, 2017 - 2029
- Figure 26:
- CHINA BIOFERTILIZER MARKET, VALUE SHARE(%), BY CROP TYPE, 2022 - 2029
- Figure 27:
- CHINA BIOFERTILIZER MARKET, BY CROP TYPE, VOLUME, METRIC TON, 2017 - 2029
- Figure 28:
- CHINA BIOFERTILIZER MARKET, BY CROP TYPE, VALUE, USD, 2017 - 2029
- Figure 29:
- CHINA BIOFERTILIZER MARKET, VOLUME SHARE(%), BY CROP TYPE, 2017 - 2029
- Figure 30:
- CHINA BIOFERTILIZER MARKET, VALUE SHARE(%), BY CROP TYPE, 2017 - 2029
- Figure 31:
- CHINA BIOFERTILIZER MARKET, BY CROP TYPE, VOLUME, METRIC TON, 2017 - 2029
- Figure 32:
- CHINA BIOFERTILIZER MARKET, BY CROP TYPE, VALUE, USD, 2017 - 2029
- Figure 33:
- CHINA BIOFERTILIZER MARKET, VALUE SHARE(%), BY FORM, 2022 - 2029
- Figure 34:
- CHINA BIOFERTILIZER MARKET, BY CROP TYPE, VOLUME, METRIC TON, 2017 - 2029
- Figure 35:
- CHINA BIOFERTILIZER MARKET, BY CROP TYPE, VALUE, USD, 2017 - 2029
- Figure 36:
- CHINA BIOFERTILIZER MARKET, VALUE SHARE(%), BY FORM, 2022 - 2029
- Figure 37:
- CHINA BIOFERTILIZER MARKET, BY CROP TYPE, VOLUME, METRIC TON, 2017 - 2029
- Figure 38:
- CHINA BIOFERTILIZER MARKET, BY CROP TYPE, VALUE, USD, 2017 - 2029
- Figure 39:
- CHINA BIOFERTILIZER MARKET, VALUE SHARE(%), BY FORM, 2022 - 2029
- Figure 40:
- CHINA BIOFERTILIZER MARKET, MOST ACTIVE COMPANIES, BY NUMBER OF STRATEGIC MOVES, 2017-2022
- Figure 41:
- CHINA BIOFERTILIZER MARKET, MOST ADOPTED STRATEGIES, 2017-2022
- Figure 42:
- CHINA BIOFERTILIZER MARKET SHARE(%), BY MAJOR PLAYERS, 2022
China Biofertilizer Industry Segmentation
Azospirillum, Azotobacter, Mycorrhiza, Phosphate Solubilizing Bacteria, Rhizobium are covered as segments by Form. Cash Crops, Horticultural Crops, Row Crops are covered as segments by Crop Type.| Form | |
| Azospirillum | |
| Azotobacter | |
| Mycorrhiza | |
| Phosphate Solubilizing Bacteria | |
| Rhizobium | |
| Other Biofertilizers |
| Crop Type | |
| Cash Crops | |
| Horticultural Crops | |
| Row Crops |
Market Definition
- AVERAGE DOSAGE RATE - This refers to the average volume of biofertilizers applied per hectare of farmland in the country.
- CROP TYPE - Row Crops: Cereals, Pulses, Oilseeds, and Forage Crops Horticulture: Fruits, and Vegetables, Cash Crops: Plantation Crops and Spices.
- FUNCTIONS - Biofertilizer
- MARKET ESTIMATION LEVEL - Market Estimations for various types of biofertilizers fertilizers has been done at the product-level.
Research Methodology
Mordor Intelligence follows a four-step methodology in all our reports.
- Step-1: Identify Key Variables: In order to build a robust forecasting methodology, the variables and factors identified in Step-1 are tested against available historical market numbers. Through an iterative process, the variables required for market forecast are set and the model is built on the basis of these variables.
- Step-2: Build a Market Model: Market-size estimations for the forecast years are in nominal terms. Inflation is not a part of the pricing, and the average selling price (ASP) is kept constant throughout the forecast period.
- Step-3: Validate and Finalize: In this important step, all market numbers, variables and analyst calls are validated through an extensive network of primary research experts from the market studied. The respondents are selected across levels and functions to generate a holistic picture of the market studied.
- Step-4: Research Outputs: Syndicated Reports, Custom Consulting Assignments, Databases & Subscription Platforms.


